
- Start >
- Rivers >
- Waterlevel >
- Bayern >
- Würzburg >
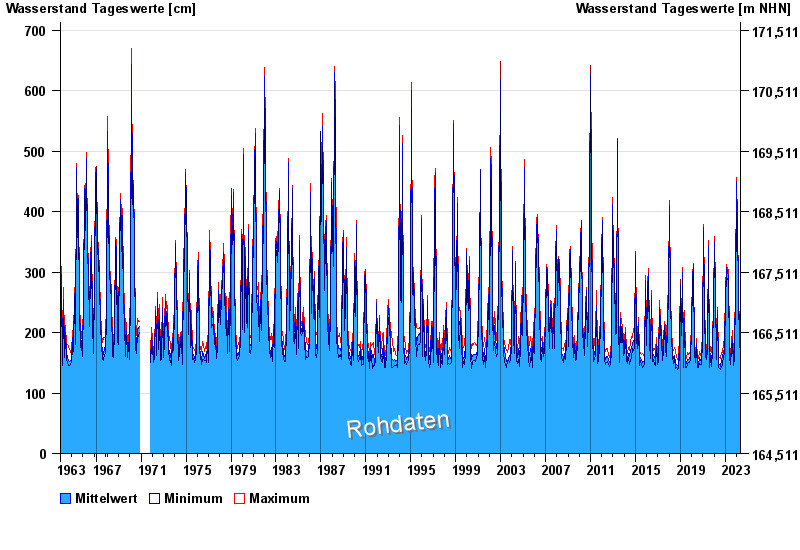
- Chart of total period

Chart of total period Würzburg / Main
Waterlevel from 28.10.1963 to 10.05.2024
| Date | Mean value [cm] | Maximum [cm] | Minimum [cm] |
|---|---|---|---|
| 10.05.2024 | 160 | 165 | 154 |
| 09.05.2024 | 160 | 169 | 155 |
| 08.05.2024 | 165 | 174 | 156 |
| 07.05.2024 | 166 | 174 | 160 |
| 06.05.2024 | 163 | 173 | 155 |
| 05.05.2024 | 164 | 171 | 112 |
| 04.05.2024 | 168 | 177 | 158 |
© Bayerisches Landesamt für Umwelt 2024