
- Start >
- Rivers >
- Waterlevel >
- Bayern >
- Würzburg >
- Chart of total period

Chart of total period Würzburg / Main
Waterlevel from 28.10.1963 to 27.04.2024
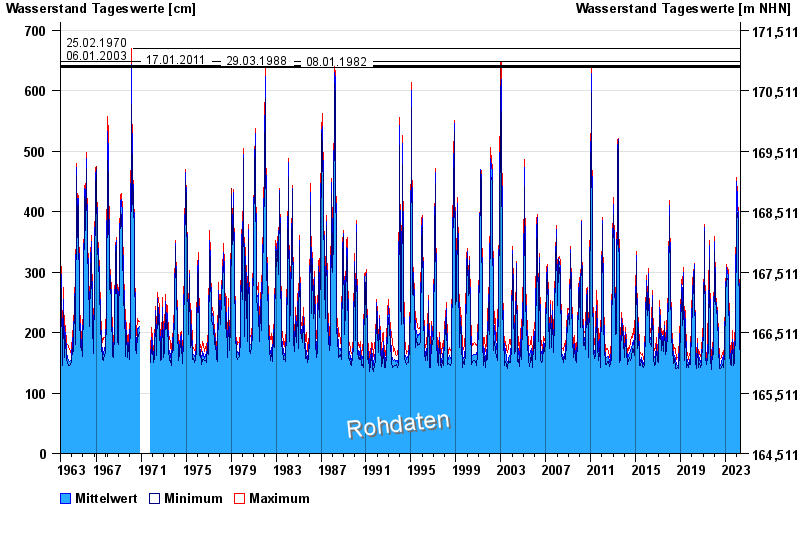
- 25.02.1970 Wasserstand: 669 cm
- 06.01.2003 Wasserstand: 648 cm
- 17.01.2011 Wasserstand: 642 cm
- 29.03.1988 Wasserstand: 640 cm
- 08.01.1982 Wasserstand: 639 cm
| Date | Mean value [cm] | Maximum [cm] | Minimum [cm] |
|---|---|---|---|
| 27.04.2024 | 163 | 164 | 162 |
| 26.04.2024 | 170 | 179 | 164 |
| 25.04.2024 | 175 | 186 | 118 |
| 24.04.2024 | 183 | 188 | 179 |
| 23.04.2024 | 194 | 198 | 186 |
| 22.04.2024 | 190 | 198 | 185 |
| 21.04.2024 | 180 | 187 | 168 |
© Bayerisches Landesamt für Umwelt 2024