
- Start >
- Rivers >
- Waterlevel >
- Bayern >
- Würzburg >
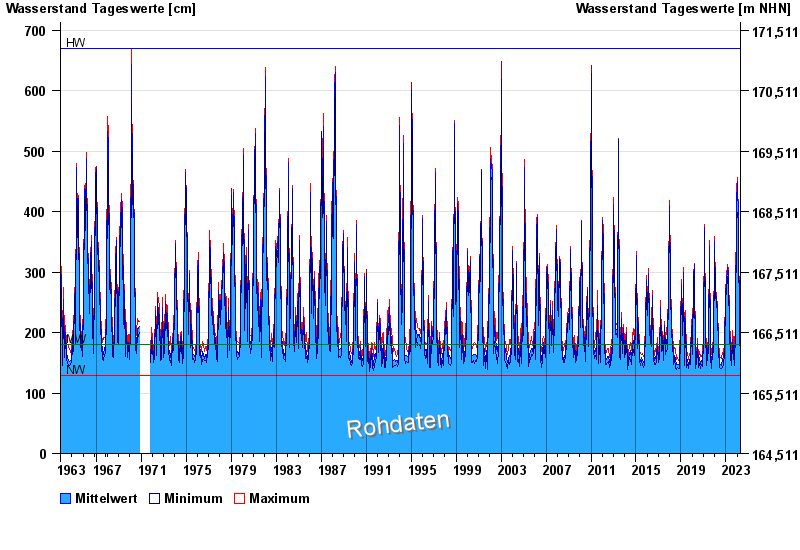
- Chart of total period

Chart of total period Würzburg / Main
Waterlevel from 28.10.1963 to 17.04.2024
| Date | Mean value [cm] | Maximum [cm] | Minimum [cm] |
|---|---|---|---|
| 17.04.2024 | 153 | 154 | 151 |
| 16.04.2024 | 154 | 157 | 150 |
| 15.04.2024 | 152 | 158 | 147 |
| 14.04.2024 | 152 | 158 | 148 |
| 13.04.2024 | 153 | 157 | 147 |
| 12.04.2024 | 155 | 159 | 151 |
| 11.04.2024 | 158 | 163 | 153 |
© Bayerisches Landesamt für Umwelt 2024