
- Start >
- Rivers >
- Discharge >
- Untere Donau >
- Deggendorf >
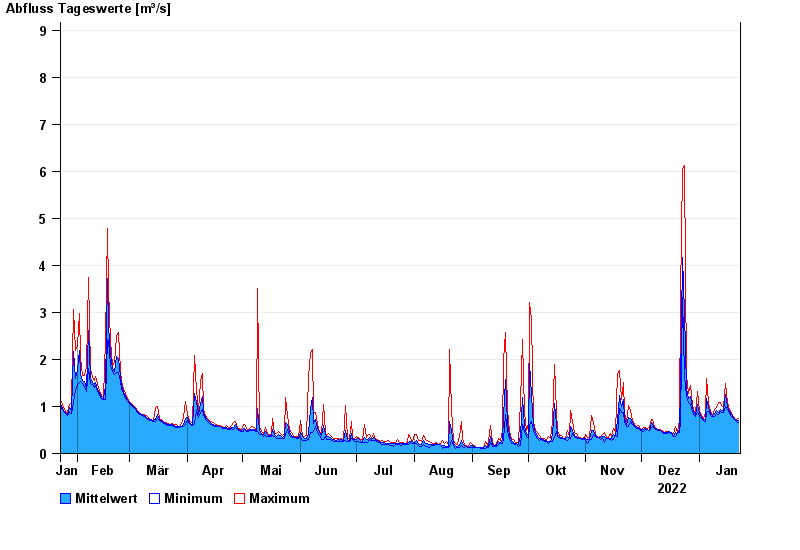
- Chart of year

Chart of year Deggendorf / Kollbach
Discharge from 23.01.2022 to 22.01.2023
- 13.01.2011 Abfluss: 26,1 m³/s
- 13.08.2002 Abfluss: 23,3 m³/s
- 08.12.1974 Abfluss: 22,6 m³/s
- 20.03.2002 Abfluss: 21,1 m³/s
- 23.02.1970 Abfluss: 19,6 m³/s
| Date | Mean value [m³/s] | Maximum [m³/s] | Minimum [m³/s] |
|---|---|---|---|
| 22.01.2023 | 0.693 | 0.741 | 0.668 |
| 21.01.2023 | 0.71 | 0.727 | 0.684 |
| 20.01.2023 | 0.739 | 0.753 | 0.726 |
| 19.01.2023 | 0.768 | 0.785 | 0.752 |
| 18.01.2023 | 0.822 | 0.854 | 0.779 |
| 17.01.2023 | 0.891 | 0.945 | 0.854 |
| 16.01.2023 | 0.999 | 1.09 | 0.938 |
© Bayerisches Landesamt für Umwelt 2024