
- Start >
- Rivers >
- Discharge >
- Untere Donau >
- Deggendorf >
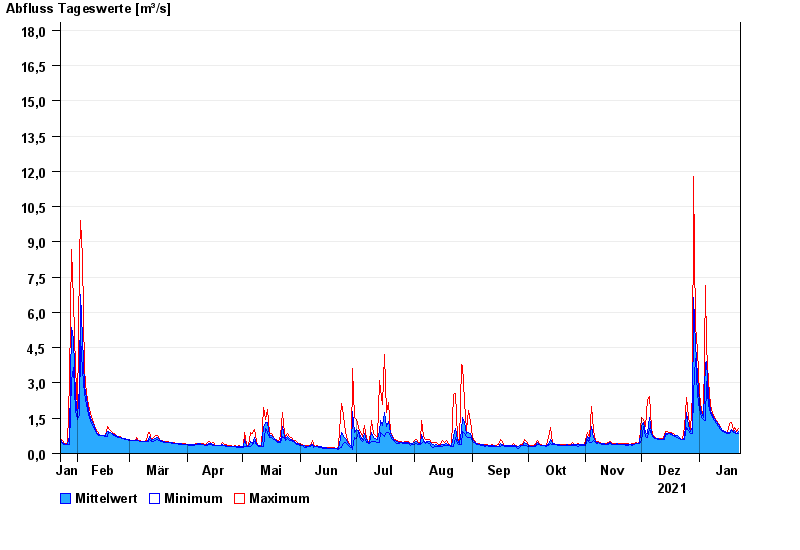
- Chart of year

Chart of year Deggendorf / Kollbach
Discharge from 23.01.2021 to 22.01.2022
- 13.01.2011 Abfluss: 26,1 m³/s
- 13.08.2002 Abfluss: 23,3 m³/s
- 08.12.1974 Abfluss: 22,6 m³/s
- 20.03.2002 Abfluss: 21,1 m³/s
- 23.02.1970 Abfluss: 19,6 m³/s
| Date | Mean value [m³/s] | Maximum [m³/s] | Minimum [m³/s] |
|---|---|---|---|
| 22.01.2022 | 0.916 | 1.05 | 0.844 |
| 21.01.2022 | 0.871 | 0.936 | 0.838 |
| 20.01.2022 | 0.966 | 1.09 | 0.879 |
| 19.01.2022 | 0.915 | 0.966 | 0.885 |
| 18.01.2022 | 1.04 | 1.31 | 0.959 |
| 17.01.2022 | 0.908 | 1.29 | 0.858 |
| 16.01.2022 | 0.886 | 0.912 | 0.864 |
© Bayerisches Landesamt für Umwelt 2024