
- Start >
- Rivers >
- Discharge >
- Untere Donau >
- Deggendorf >
- Chart of year

Chart of year Deggendorf / Kollbach
Discharge from 04.07.2023 to 03.07.2024
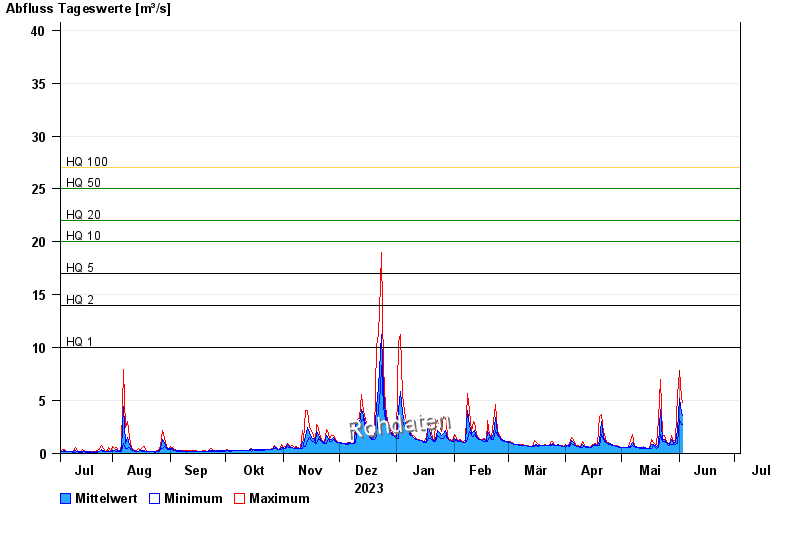
- HQ1 10 m³/s
- HQ2 14 m³/s
- HQ5 17 m³/s
- HQ10 20 m³/s
- HQ20 22 m³/s
- HQ50 25 m³/s
- HQ100 27 m³/s
| Date | Mean value [m³/s] | Maximum [m³/s] | Minimum [m³/s] |
|---|---|---|---|
| 03.07.2024 | 0.819 | 1.52 | 0.611 |
| 02.07.2024 | 0.67 | 0.775 | 0.611 |
| 01.07.2024 | 0.75 | 0.958 | 0.611 |
| 30.06.2024 | 0.629 | 1.16 | 0.511 |
| 29.06.2024 | 0.579 | 0.611 | 0.511 |
| 28.06.2024 | 0.644 | 0.832 | 0.56 |
| 27.06.2024 | 0.618 | 0.775 | 0.611 |
© Bayerisches Landesamt für Umwelt 2024