
- Start >
- Rivers >
- Discharge >
- Untere Donau >
- Deggendorf >
- Chart of year

Chart of year Deggendorf / Kollbach
Discharge from 04.07.2022 to 03.07.2023
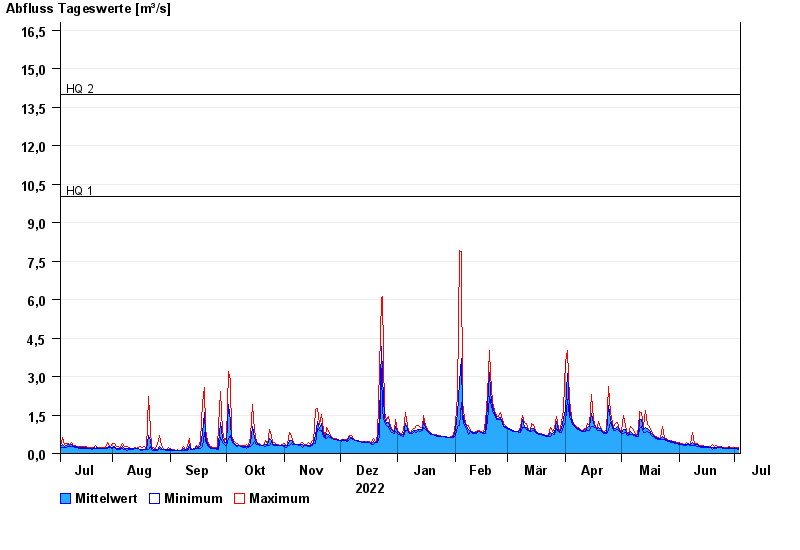
- HQ1 10 m³/s
- HQ2 14 m³/s
- HQ5 17 m³/s
- HQ10 20 m³/s
- HQ20 22 m³/s
- HQ50 25 m³/s
- HQ100 27 m³/s
| Date | Mean value [m³/s] | Maximum [m³/s] | Minimum [m³/s] |
|---|---|---|---|
| 03.07.2023 | 0.197 | 0.245 | 0.17 |
| 02.07.2023 | 0.203 | 0.221 | 0.181 |
| 01.07.2023 | 0.216 | 0.239 | 0.179 |
| 30.06.2023 | 0.211 | 0.231 | 0.179 |
| 29.06.2023 | 0.205 | 0.224 | 0.179 |
| 28.06.2023 | 0.228 | 0.291 | 0.195 |
| 27.06.2023 | 0.203 | 0.225 | 0.182 |
© Bayerisches Landesamt für Umwelt 2024