
- Start >
- Rivers >
- Waterlevel >
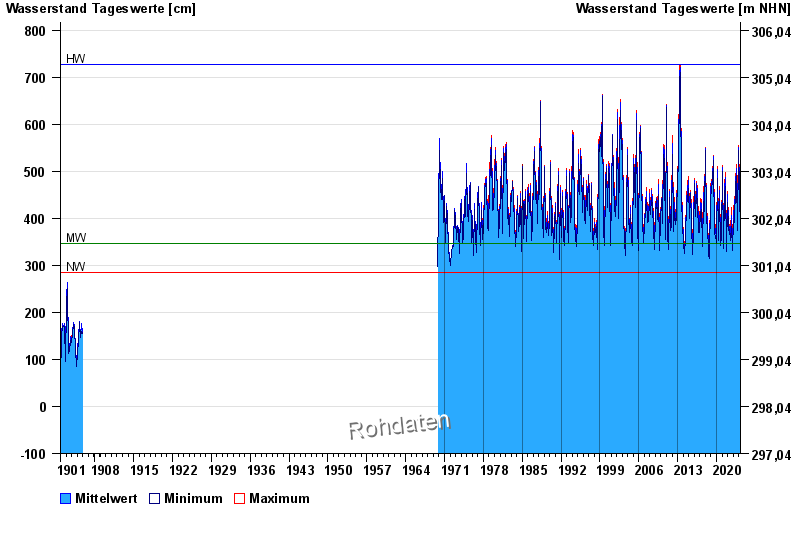
- Untere Donau >
- Vilshofen >
- Chart of total period

Chart of total period Vilshofen / Donau
Waterlevel from 01.11.1901 to 27.04.2024
| Date | Mean value [cm] | Maximum [cm] | Minimum [cm] |
|---|---|---|---|
| 27.04.2024 | 342 | 345 | 339 |
| 26.04.2024 | 344 | 347 | 341 |
| 25.04.2024 | 350 | 355 | 347 |
| 24.04.2024 | 358 | 363 | 355 |
| 23.04.2024 | 364 | 367 | 362 |
| 22.04.2024 | 369 | 370 | 367 |
| 21.04.2024 | 362 | 368 | 359 |
© Bayerisches Landesamt für Umwelt 2024