
- Start >
- Rivers >
- Waterlevel >
- Untere Donau >
- Vilshofen >
- Chart of total period

Chart of total period Vilshofen / Donau
Waterlevel from 01.11.1901 to 20.04.2024
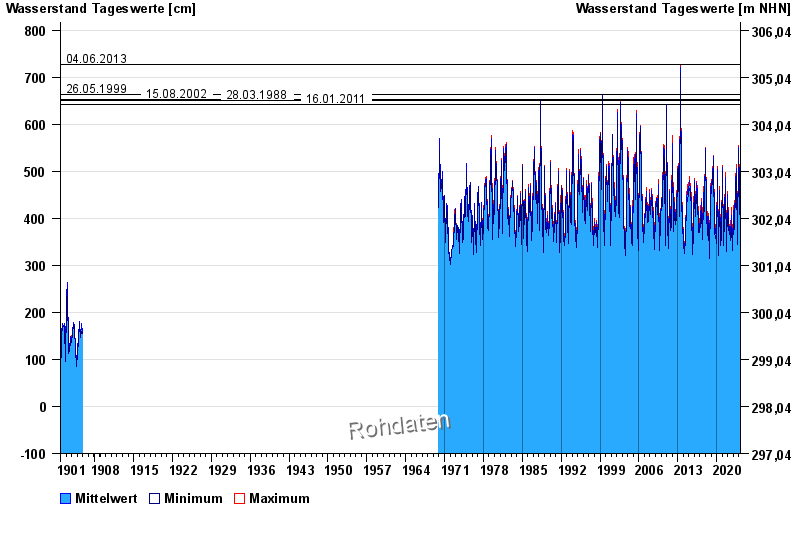
- 04.06.2013 Wasserstand: 728 cm
- 26.05.1999 Wasserstand: 664 cm
- 15.08.2002 Wasserstand: 653 cm
- 28.03.1988 Wasserstand: 651 cm
- 16.01.2011 Wasserstand: 643 cm
| Date | Mean value [cm] | Maximum [cm] | Minimum [cm] |
|---|---|---|---|
| 20.04.2024 | 356 | 356 | 356 |
| 19.04.2024 | 356 | 357 | 353 |
| 18.04.2024 | 350 | 353 | 348 |
| 17.04.2024 | 344 | 348 | 340 |
| 16.04.2024 | 338 | 342 | 335 |
| 15.04.2024 | 335 | 337 | 333 |
| 14.04.2024 | 333 | 335 | 332 |
© Bayerisches Landesamt für Umwelt 2024