
- Start >
- Rivers >
- Waterlevel >
- Untere Donau >
- Vilshofen >
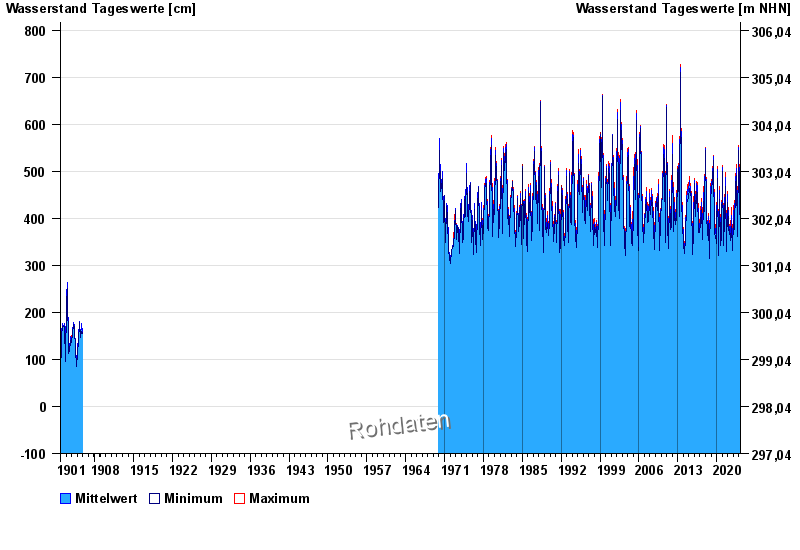
- Chart of total period

Chart of total period Vilshofen / Donau
Waterlevel from 01.11.1901 to 19.04.2024
| Date | Mean value [cm] | Maximum [cm] | Minimum [cm] |
|---|---|---|---|
| 19.04.2024 | 354 | 355 | 353 |
| 18.04.2024 | 350 | 353 | 348 |
| 17.04.2024 | 344 | 348 | 340 |
| 16.04.2024 | 338 | 342 | 335 |
| 15.04.2024 | 335 | 337 | 333 |
| 14.04.2024 | 333 | 335 | 332 |
| 13.04.2024 | 335 | 337 | 333 |
© Bayerisches Landesamt für Umwelt 2024