
- Start >
- Rivers >
- Waterlevel >
- Naab - Regen >
- Hocha Perlseeabfluss >
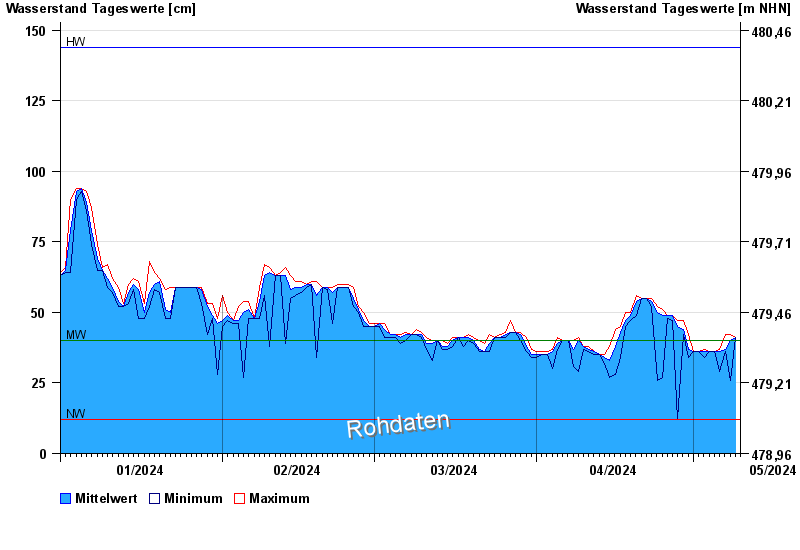
- Chart of year

Chart of year Hocha Perlseeabfluss / Schwarzach
Waterlevel from 01.01.2024 to 09.05.2024
| Date | Mean value [cm] | Maximum [cm] | Minimum [cm] |
|---|---|---|---|
| 09.05.2024 | 41 | 41 | 41 |
| 08.05.2024 | 40 | 42 | 26 |
| 07.05.2024 | 37 | 42 | 36 |
| 06.05.2024 | 36 | 37 | 29 |
| 05.05.2024 | 36 | 36 | 36 |
| 04.05.2024 | 36 | 36 | 36 |
| 03.05.2024 | 36 | 37 | 34 |
© Bayerisches Landesamt für Umwelt 2024