
- Start >
- Rivers >
- Waterlevel >
- Naab - Regen >
- Hocha Perlseeabfluss >
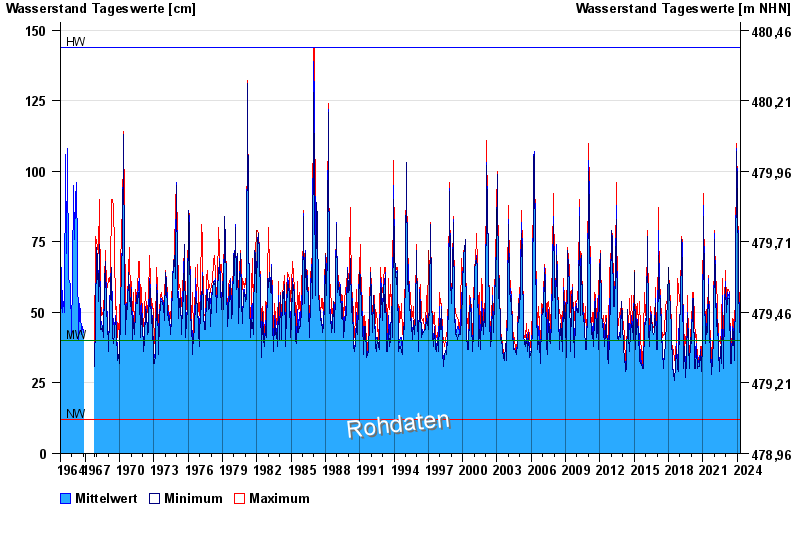
- Chart of total period

Chart of total period Hocha Perlseeabfluss / Schwarzach
Waterlevel from 01.11.1964 to 19.04.2024
| Date | Mean value [cm] | Maximum [cm] | Minimum [cm] |
|---|---|---|---|
| 19.04.2024 | 48 | 50 | 47 |
| 18.04.2024 | 47 | 50 | 45 |
| 17.04.2024 | 43 | 45 | 34 |
| 16.04.2024 | 38 | 44 | 28 |
| 15.04.2024 | 33 | 38 | 27 |
| 14.04.2024 | 34 | 35 | 32 |
| 13.04.2024 | 35 | 35 | 35 |
© Bayerisches Landesamt für Umwelt 2024