
- Start >
- Rivers >
- Waterlevel >
- Naab - Regen >
- Hocha Perlseeabfluss >
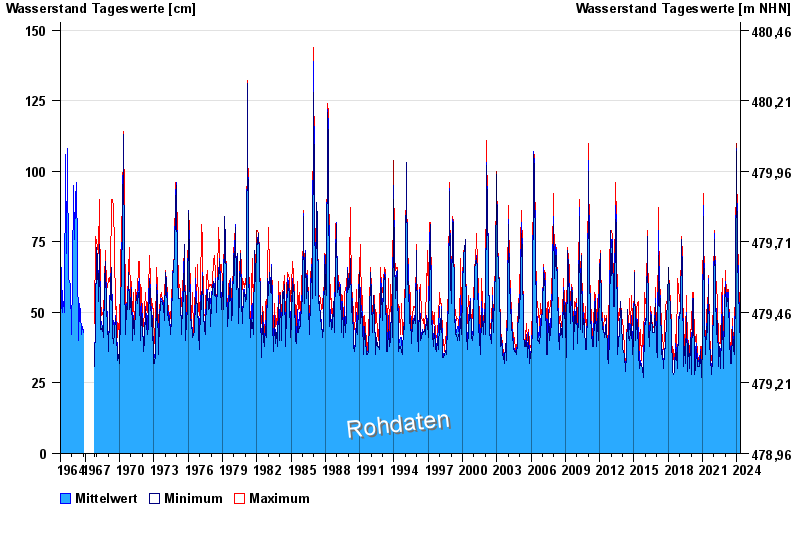
- Chart of total period

Chart of total period Hocha Perlseeabfluss / Schwarzach
Waterlevel from 01.11.1964 to 27.04.2024
 Für diesen Pegel sind keine Meldestufen hinterlegt.
| Date | Mean value [cm] | Maximum [cm] | Minimum [cm] |
|---|---|---|---|
| 27.04.2024 | 49 | 49 | 49 |
| 26.04.2024 | 49 | 49 | 48 |
| 25.04.2024 | 49 | 51 | 27 |
| 24.04.2024 | 50 | 52 | 26 |
| 23.04.2024 | 54 | 55 | 52 |
| 22.04.2024 | 55 | 55 | 55 |
| 21.04.2024 | 55 | 55 | 55 |
© Bayerisches Landesamt für Umwelt 2024