
- Start >
- Rivers >
- Waterlevel >
- Obere Donau >
- Weißenburg >
- Chart of total period

Chart of total period Weißenburg / Schwäbische Rezat
Waterlevel from 01.11.1969 to 26.04.2024
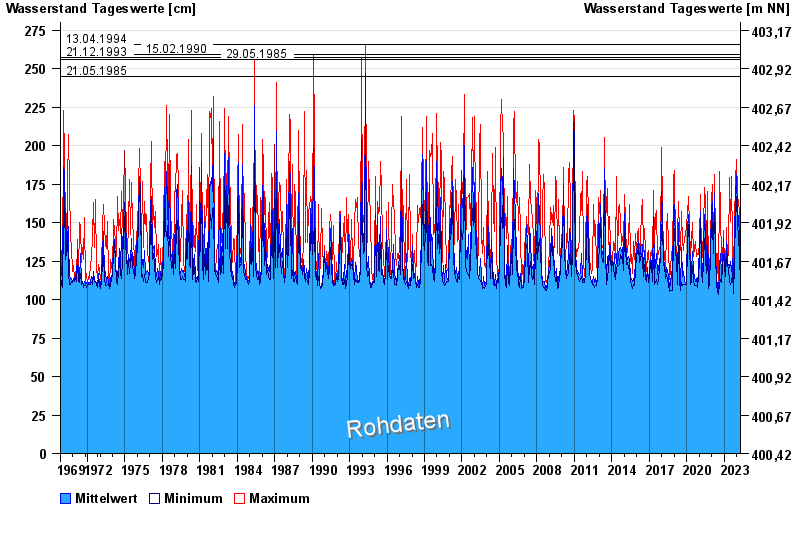
- 13.04.1994 Wasserstand: 266 cm
- 15.02.1990 Wasserstand: 259 cm
- 21.12.1993 Wasserstand: 257 cm
- 29.05.1985 Wasserstand: 256 cm
- 21.05.1985 Wasserstand: 245 cm
| Date | Mean value [cm] | Maximum [cm] | Minimum [cm] |
|---|---|---|---|
| 26.04.2024 | 111 | 121 | 109 |
| 25.04.2024 | 110 | 110 | 109 |
| 24.04.2024 | 110 | 111 | 110 |
| 23.04.2024 | 113 | 122 | 110 |
| 22.04.2024 | 113 | 116 | 111 |
| 21.04.2024 | 114 | 123 | 111 |
| 20.04.2024 | 114 | 129 | 111 |
© Bayerisches Landesamt für Umwelt 2024