
- Start >
- Rivers >
- Waterlevel >
- Obere Donau >
- Weißenburg >
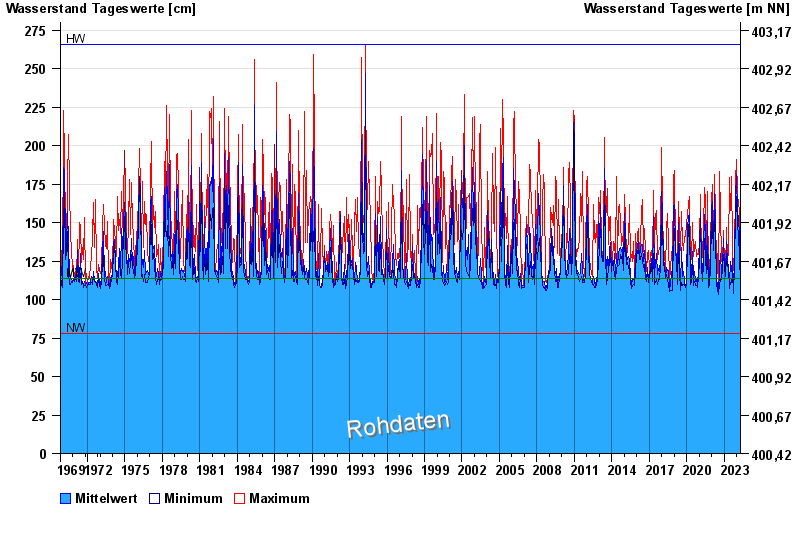
- Chart of total period

Chart of total period Weißenburg / Schwäbische Rezat
Waterlevel from 01.11.1969 to 24.04.2024
| Date | Mean value [cm] | Maximum [cm] | Minimum [cm] |
|---|---|---|---|
| 24.04.2024 | 111 | 111 | 111 |
| 23.04.2024 | 113 | 122 | 110 |
| 22.04.2024 | 113 | 116 | 111 |
| 21.04.2024 | 114 | 123 | 111 |
| 20.04.2024 | 114 | 129 | 111 |
| 19.04.2024 | 112 | 115 | 110 |
| 18.04.2024 | 111 | 113 | 110 |
© Bayerisches Landesamt für Umwelt 2024