
- Start >
- Rivers >
- Waterlevel >
- Isar >
- Bad Feilnbach >
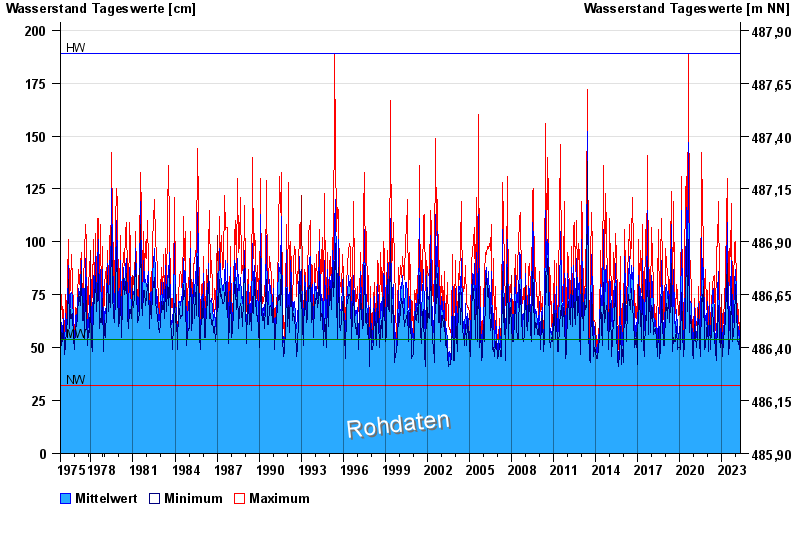
- Chart of total period

Chart of total period Bad Feilnbach / Jenbach
Waterlevel from 01.11.1975 to 30.04.2024
| Date | Mean value [cm] | Maximum [cm] | Minimum [cm] |
|---|---|---|---|
| 30.04.2024 | 65 | 67 | 63 |
| 29.04.2024 | 65 | 68 | 60 |
| 28.04.2024 | 65 | 70 | 60 |
| 27.04.2024 | 57 | 66 | 51 |
| 26.04.2024 | 52 | 58 | 48 |
| 25.04.2024 | 52 | 55 | 49 |
| 24.04.2024 | 51 | 56 | 48 |
© Bayerisches Landesamt für Umwelt 2024