
- Start >
- Rivers >
- Waterlevel >
- Isar >
- Bad Feilnbach >
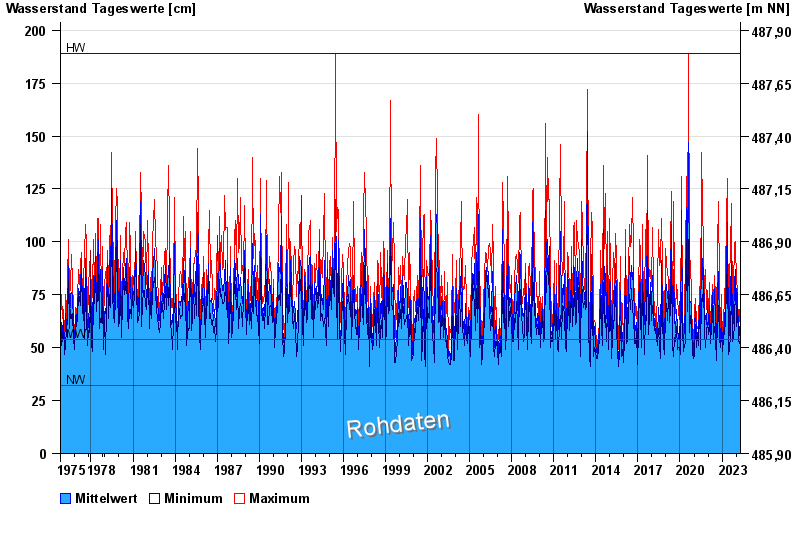
- Chart of total period

Chart of total period Bad Feilnbach / Jenbach
Waterlevel from 01.11.1975 to 24.04.2024
| Date | Mean value [cm] | Maximum [cm] | Minimum [cm] |
|---|---|---|---|
| 24.04.2024 | 49 | 55 | 48 |
| 23.04.2024 | 50 | 52 | 49 |
| 22.04.2024 | 51 | 53 | 50 |
| 21.04.2024 | 50 | 55 | 48 |
| 20.04.2024 | 49 | 54 | 47 |
| 19.04.2024 | 44 | 49 | 42 |
| 18.04.2024 | 43 | 46 | 42 |
© Bayerisches Landesamt für Umwelt 2024