
- Start >
- Rivers >
- Waterlevel >
- Isar >
- Bad Feilnbach >
- Chart of total period

Chart of total period Bad Feilnbach / Jenbach
Waterlevel from 01.11.1975 to 20.04.2024
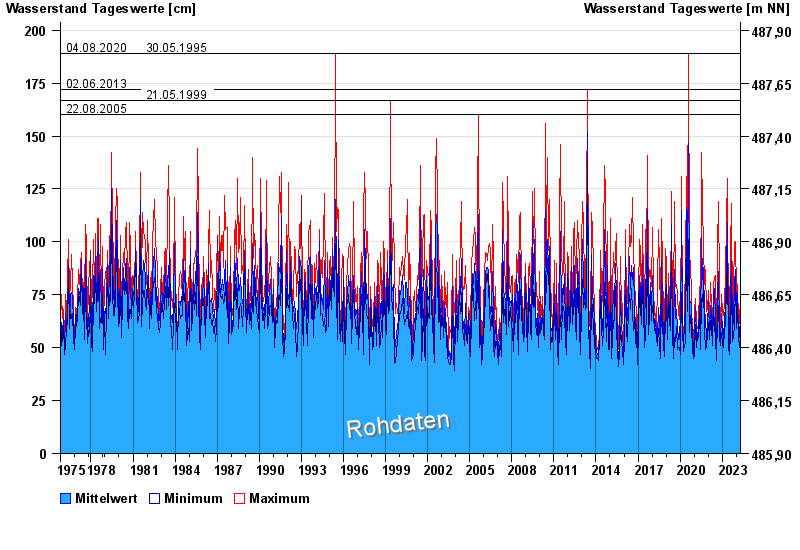
- 04.08.2020 Wasserstand: 189 cm
- 30.05.1995 Wasserstand: 189 cm
- 02.06.2013 Wasserstand: 172 cm
- 21.05.1999 Wasserstand: 167 cm
- 22.08.2005 Wasserstand: 160 cm
| Date | Mean value [cm] | Maximum [cm] | Minimum [cm] |
|---|---|---|---|
| 20.04.2024 | 49 | 51 | 47 |
| 19.04.2024 | 44 | 49 | 42 |
| 18.04.2024 | 43 | 46 | 42 |
| 17.04.2024 | 43 | 49 | 40 |
| 16.04.2024 | 43 | 45 | 40 |
| 15.04.2024 | 44 | 46 | 41 |
| 14.04.2024 | 44 | 46 | 42 |
© Bayerisches Landesamt für Umwelt 2024