
- Start >
- Rivers >
- Waterlevel >
- Oberer Main - Elbe >
- Coburg >
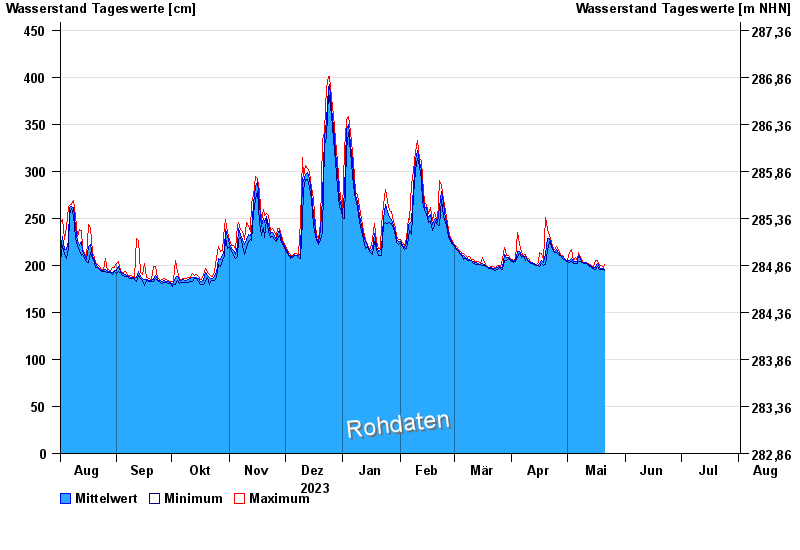
- Chart of year

Chart of year Coburg / Itz
Waterlevel from 02.08.2023 to 01.08.2024
| Date | Mean value [cm] | Maximum [cm] | Minimum [cm] |
|---|---|---|---|
| 15.06.2024 | 196 | 196 | 196 |
| 14.06.2024 | 196 | 197 | 194 |
| 13.06.2024 | 197 | 198 | 196 |
| 12.06.2024 | 199 | 200 | 198 |
| 11.06.2024 | 200 | 208 | 196 |
| 10.06.2024 | 202 | 203 | 201 |
| 09.06.2024 | 203 | 205 | 203 |
© Bayerisches Landesamt für Umwelt 2024