
- Start >
- Rivers >
- Waterlevel >
- Oberer Main - Elbe >
- Coburg >
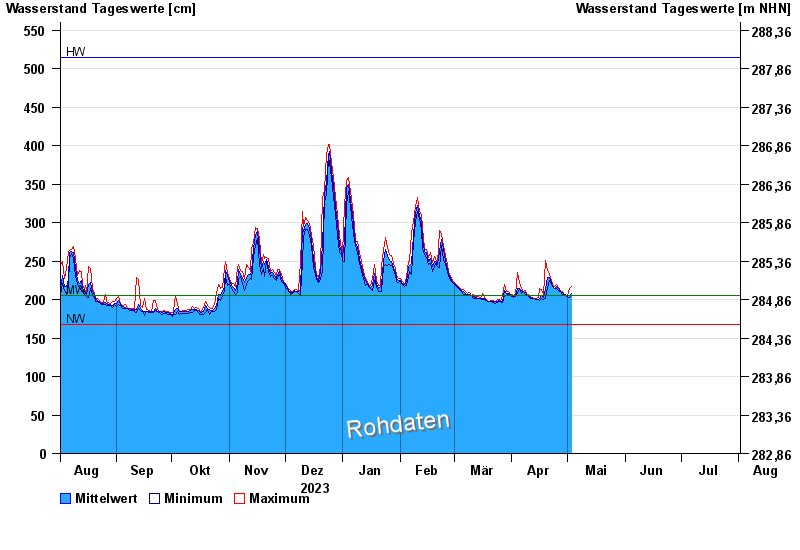
- Chart of year

Chart of year Coburg / Itz
Waterlevel from 02.08.2023 to 01.08.2024
| Date | Mean value [cm] | Maximum [cm] | Minimum [cm] |
|---|---|---|---|
| 03.06.2024 | 234 | 242 | 225 |
| 02.06.2024 | 263 | 292 | 243 |
| 01.06.2024 | 218 | 267 | 204 |
| 31.05.2024 | 212 | 217 | 206 |
| 30.05.2024 | 209 | 220 | 196 |
| 29.05.2024 | 200 | 203 | 196 |
| 28.05.2024 | 201 | 203 | 199 |
© Bayerisches Landesamt für Umwelt 2024