
- Start >
- Rivers >
- Waterlevel >
- Oberer Main - Elbe >
- Coburg >
- Chart of total period

Chart of total period Coburg / Itz
Waterlevel from 01.11.1974 to 26.04.2024
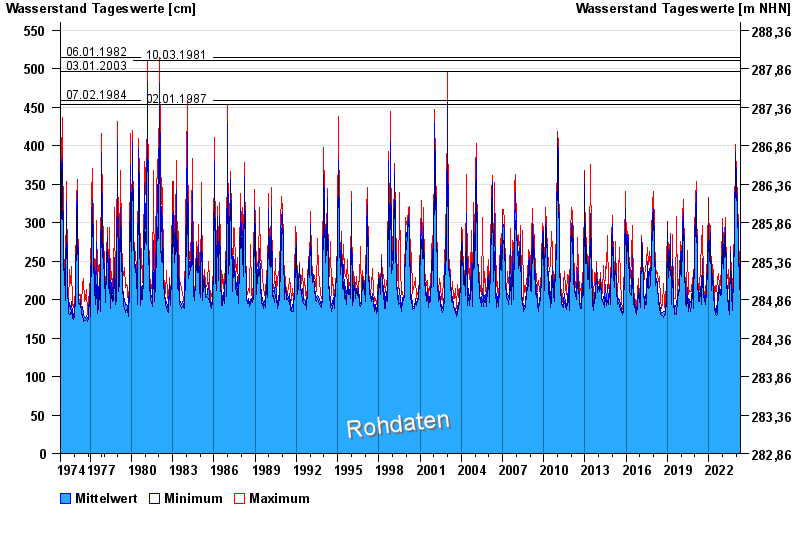
- 06.01.1982 Wasserstand: 514 cm
- 10.03.1981 Wasserstand: 510 cm
- 03.01.2003 Wasserstand: 496 cm
- 07.02.1984 Wasserstand: 459 cm
- 02.01.1987 Wasserstand: 454 cm
| Date | Mean value [cm] | Maximum [cm] | Minimum [cm] |
|---|---|---|---|
| 26.04.2024 | 216 | 216 | 215 |
| 25.04.2024 | 217 | 220 | 214 |
| 24.04.2024 | 215 | 217 | 214 |
| 23.04.2024 | 218 | 220 | 217 |
| 22.04.2024 | 222 | 225 | 220 |
| 21.04.2024 | 229 | 232 | 225 |
| 20.04.2024 | 229 | 238 | 216 |
© Bayerisches Landesamt für Umwelt 2024