
- Start >
- Rivers >
- Waterlevel >
- Bayern >
- Unterbruck >
- Chart of year

Chart of year Unterbruck / Haidenaab
Waterlevel from 30.01.2024 to 29.01.2025
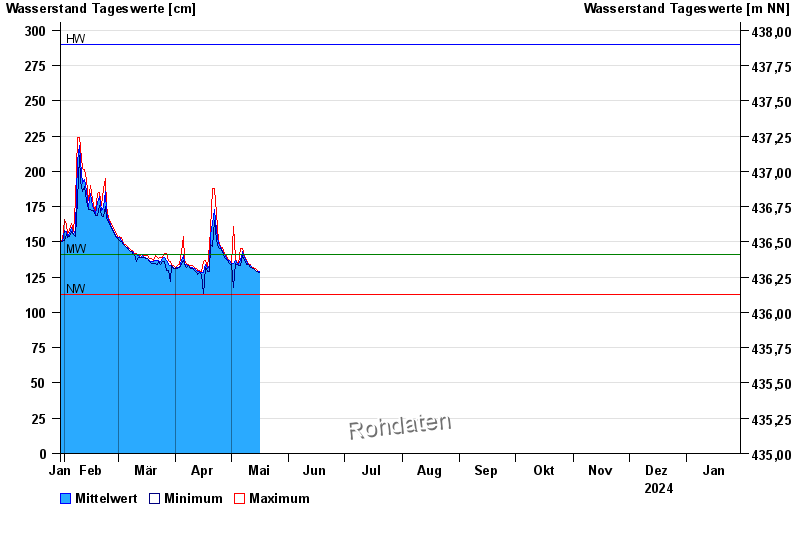
| Date | Mean value [cm] | Maximum [cm] | Minimum [cm] |
|---|---|---|---|
| 29.04.2024 | 138 | 138 | 137 |
| 28.04.2024 | 140 | 141 | 138 |
| 27.04.2024 | 142 | 143 | 140 |
| 26.04.2024 | 144 | 146 | 143 |
| 25.04.2024 | 146 | 147 | 145 |
| 24.04.2024 | 149 | 151 | 146 |
| 23.04.2024 | 158 | 170 | 151 |
© Bayerisches Landesamt für Umwelt 2024