
- Start >
- Rivers >
- Waterlevel >
- Bayern >
- Pegnitz >
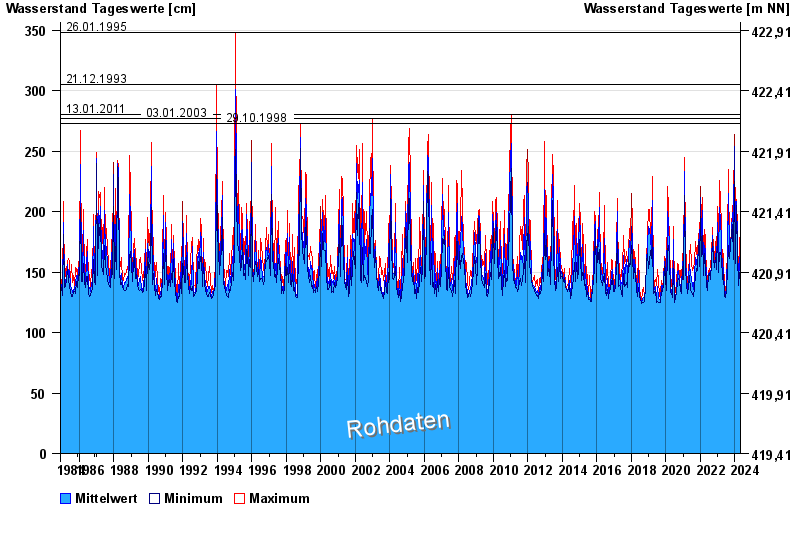
- Chart of total period

Chart of total period Pegnitz / Fichtenohe
Waterlevel from 26.11.1984 to 01.05.2024
note
Aufstau durch Biberdamm
- 26.01.1995 Wasserstand: 348 cm
- 21.12.1993 Wasserstand: 305 cm
- 13.01.2011 Wasserstand: 280 cm
- 03.01.2003 Wasserstand: 277 cm
- 29.10.1998 Wasserstand: 273 cm
| Date | Mean value [cm] | Maximum [cm] | Minimum [cm] |
|---|---|---|---|
| 01.05.2024 | 136 | 137 | 135 |
| 30.04.2024 | 136 | 137 | 136 |
| 29.04.2024 | 137 | 137 | 136 |
| 28.04.2024 | 137 | 138 | 137 |
| 27.04.2024 | 138 | 139 | 138 |
| 26.04.2024 | 140 | 141 | 139 |
| 25.04.2024 | 141 | 142 | 140 |
© Bayerisches Landesamt für Umwelt 2024