
- Start >
- Rivers >
- Waterlevel >
- Bayern >
- Pegnitz >
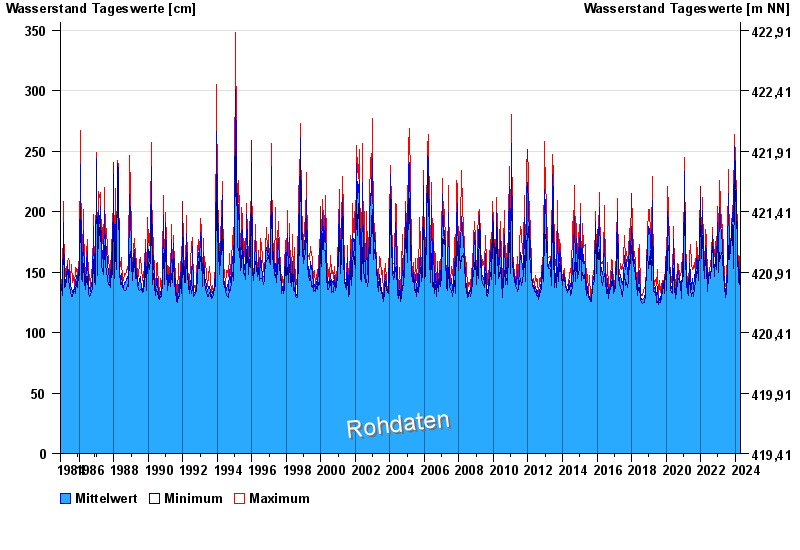
- Chart of total period

Chart of total period Pegnitz / Fichtenohe
Waterlevel from 26.11.1984 to 25.04.2024
 Für diesen Pegel sind keine Hochwassermarken hinterlegt.
note
Aufstau durch Biberdamm
| Date | Mean value [cm] | Maximum [cm] | Minimum [cm] |
|---|---|---|---|
| 25.04.2024 | 141 | 142 | 140 |
| 24.04.2024 | 141 | 143 | 140 |
| 23.04.2024 | 145 | 148 | 143 |
| 22.04.2024 | 158 | 178 | 148 |
| 21.04.2024 | 162 | 179 | 148 |
| 20.04.2024 | 158 | 166 | 150 |
| 19.04.2024 | 144 | 164 | 138 |
© Bayerisches Landesamt für Umwelt 2024