
- Start >
- Rivers >
- Waterlevel >
- Bayern >
- Bayreuth >
- Chart of total period

Chart of total period Bayreuth / Roter Main
Waterlevel from 03.10.1924 to 26.04.2024
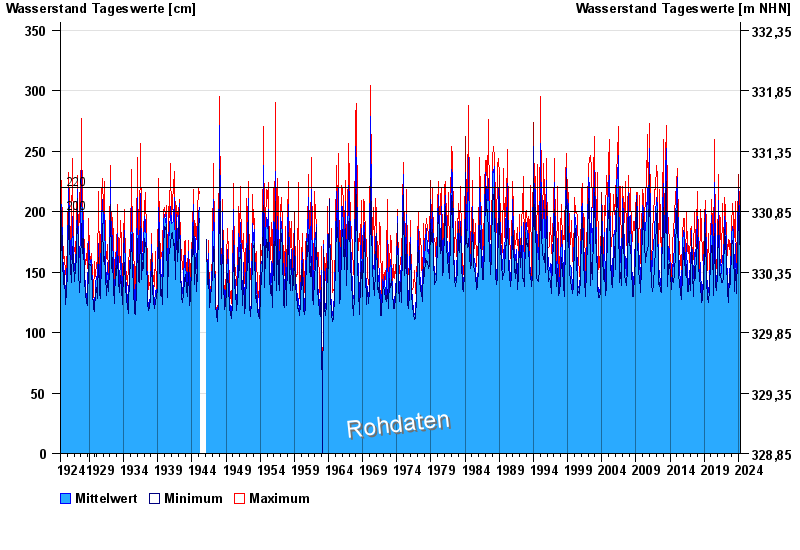
- 200 cm: Bayreuth: Ausuferung bei den Auwiesen unterhalb des Pegels.
- 220 cm: Verbindungsstraße Heinersreuth - Cottenbach: Überflutung im Maintal.
| Date | Mean value [cm] | Maximum [cm] | Minimum [cm] |
|---|---|---|---|
| 26.04.2024 | 143 | 143 | 142 |
| 25.04.2024 | 143 | 145 | 142 |
| 24.04.2024 | 144 | 146 | 143 |
| 23.04.2024 | 150 | 155 | 146 |
| 22.04.2024 | 165 | 182 | 155 |
| 21.04.2024 | 167 | 186 | 149 |
| 20.04.2024 | 154 | 158 | 149 |
© Bayerisches Landesamt für Umwelt 2024