
- Start >
- Rivers >
- Waterlevel >
- Bayern >
- Bayreuth >
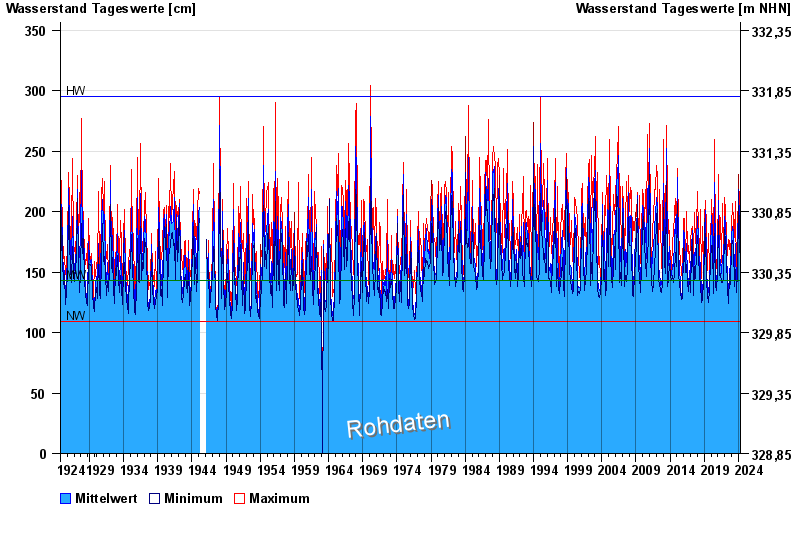
- Chart of total period

Chart of total period Bayreuth / Roter Main
Waterlevel from 03.10.1924 to 19.04.2024
| Date | Mean value [cm] | Maximum [cm] | Minimum [cm] |
|---|---|---|---|
| 19.04.2024 | 138 | 150 | 134 |
| 18.04.2024 | 136 | 137 | 135 |
| 17.04.2024 | 137 | 139 | 135 |
| 16.04.2024 | 134 | 145 | 132 |
| 15.04.2024 | 133 | 134 | 132 |
| 14.04.2024 | 133 | 134 | 133 |
| 13.04.2024 | 133 | 134 | 132 |
© Bayerisches Landesamt für Umwelt 2024