

Chart of year Schwabach / Schwabach
Discharge from 01.01.2022 to 31.12.2022
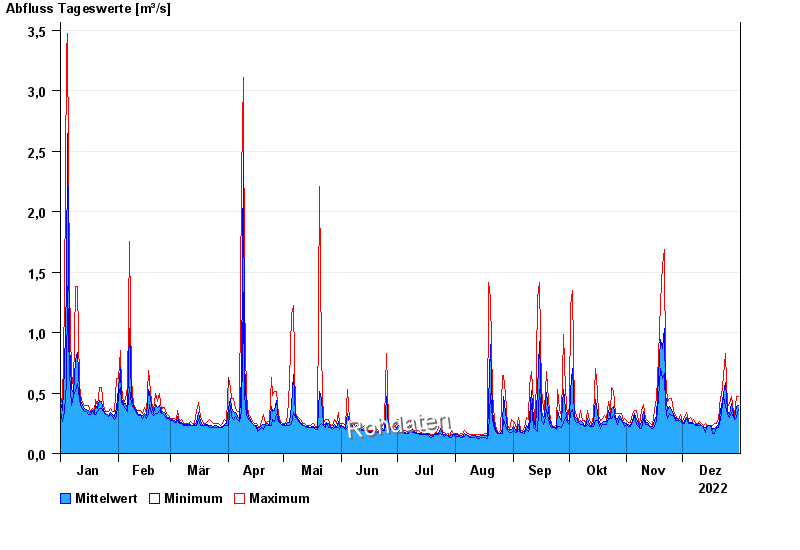
| Date | Mean value [m³/s] | Maximum [m³/s] | Minimum [m³/s] |
|---|---|---|---|
| 31.12.2022 | 0.397 | 0.468 | 0.363 |
| 30.12.2022 | 0.392 | 0.468 | 0.298 |
| 29.12.2022 | 0.291 | 0.319 | 0.279 |
| 28.12.2022 | 0.311 | 0.34 | 0.298 |
| 27.12.2022 | 0.414 | 0.468 | 0.34 |
| 26.12.2022 | 0.322 | 0.413 | 0.298 |
| 25.12.2022 | 0.346 | 0.387 | 0.319 |
© Bayerisches Landesamt für Umwelt 2024