

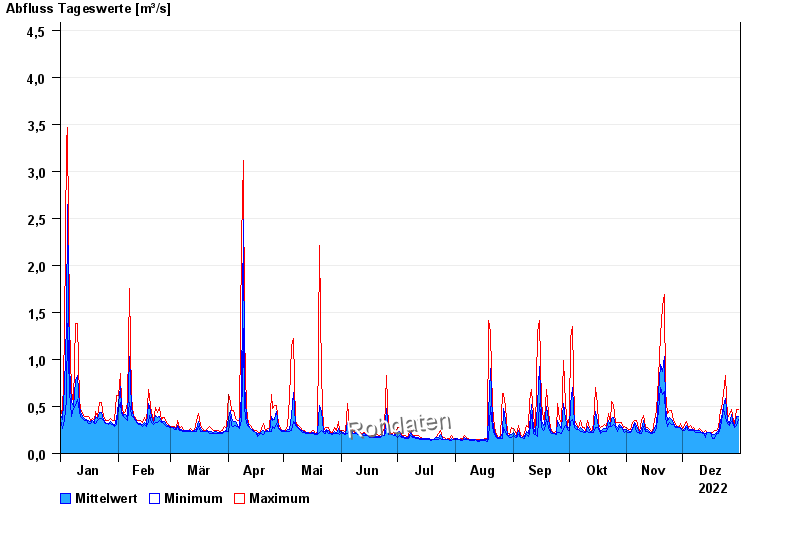
Chart of year Schwabach / Schwabach
Discharge from 01.01.2022 to 31.12.2022
- 08.01.2011 Abfluss: 8,17 m³/s
- 09.03.2006 Abfluss: 8,11 m³/s
- 02.03.1987 Abfluss: 7,37 m³/s
- 29.10.1998 Abfluss: 7,36 m³/s
- 16.03.2005 Abfluss: 7,26 m³/s
| Date | Mean value [m³/s] | Maximum [m³/s] | Minimum [m³/s] |
|---|---|---|---|
| 31.12.2022 | 0.397 | 0.468 | 0.363 |
| 30.12.2022 | 0.392 | 0.468 | 0.298 |
| 29.12.2022 | 0.291 | 0.319 | 0.279 |
| 28.12.2022 | 0.311 | 0.34 | 0.298 |
| 27.12.2022 | 0.414 | 0.468 | 0.34 |
| 26.12.2022 | 0.322 | 0.413 | 0.298 |
| 25.12.2022 | 0.346 | 0.387 | 0.319 |
© Bayerisches Landesamt für Umwelt 2024