

Chart of year Schwabach / Schwabach
Discharge from 01.01.2023 to 31.12.2023
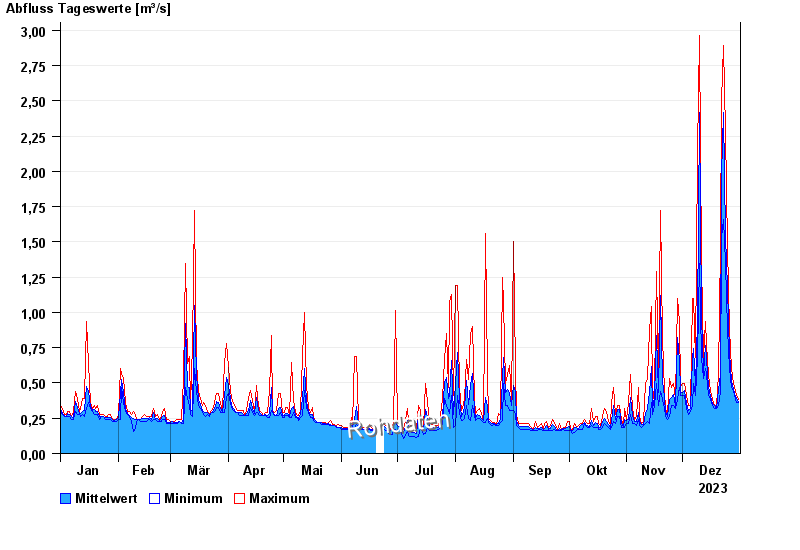
| Date | Mean value [m³/s] | Maximum [m³/s] | Minimum [m³/s] |
|---|---|---|---|
| 31.12.2023 | 0.365 | 0.385 | 0.361 |
| 30.12.2023 | 0.389 | 0.41 | 0.361 |
| 29.12.2023 | 0.418 | 0.466 | 0.41 |
| 28.12.2023 | 0.461 | 0.496 | 0.437 |
| 27.12.2023 | 0.513 | 0.599 | 0.466 |
| 26.12.2023 | 0.71 | 0.878 | 0.599 |
| 25.12.2023 | 1.18 | 1.47 | 0.878 |
© Bayerisches Landesamt für Umwelt 2024