
- Start >
- Rivers >
- Discharge >
- Untere Donau >
- Wallersdorf >
- Chart of year

Chart of year Wallersdorf / Reißingerbach
Discharge from 11.08.2020 to 10.08.2021
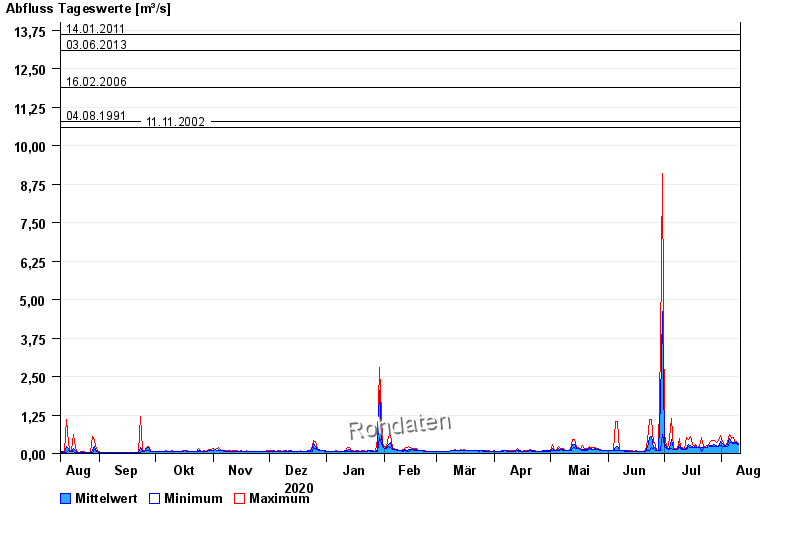
- 14.01.2011 Abfluss: 13,6 m³/s
- 03.06.2013 Abfluss: 13,1 m³/s
- 16.02.2006 Abfluss: 11,9 m³/s
- 04.08.1991 Abfluss: 10,8 m³/s
- 11.11.2002 Abfluss: 10,6 m³/s
| Date | Mean value [m³/s] | Maximum [m³/s] | Minimum [m³/s] |
|---|---|---|---|
| 10.08.2021 | 0.316 | 0.322 | 0.298 |
| 09.08.2021 | 0.368 | 0.406 | 0.322 |
| 08.08.2021 | 0.368 | 0.406 | 0.322 |
| 07.08.2021 | 0.364 | 0.506 | 0.322 |
| 06.08.2021 | 0.385 | 0.472 | 0.348 |
| 05.08.2021 | 0.498 | 0.617 | 0.322 |
| 04.08.2021 | 0.285 | 0.348 | 0.235 |
© Bayerisches Landesamt für Umwelt 2024