
- Start >
- Rivers >
- Discharge >
- Untere Donau >
- Wallersdorf >
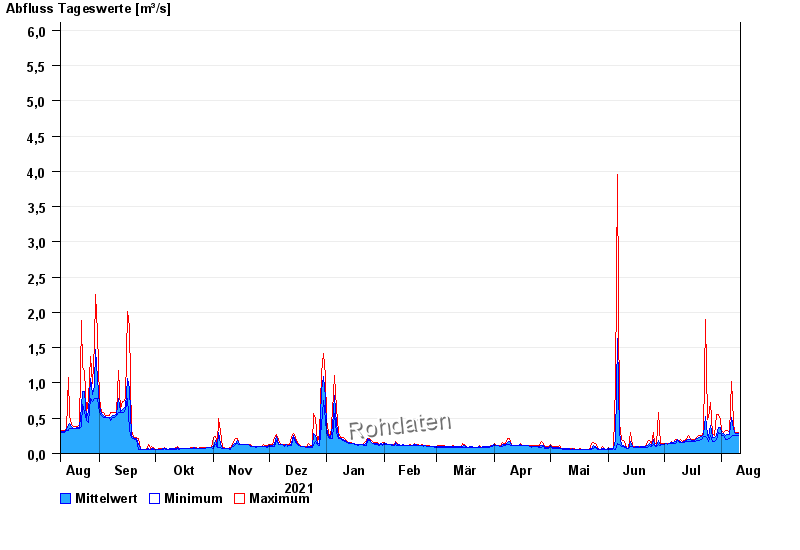
- Chart of year

Chart of year Wallersdorf / Reißingerbach
Discharge from 11.08.2021 to 10.08.2022
- 14.01.2011 Abfluss: 13,6 m³/s
- 03.06.2013 Abfluss: 13,1 m³/s
- 16.02.2006 Abfluss: 11,9 m³/s
- 04.08.1991 Abfluss: 10,8 m³/s
- 11.11.2002 Abfluss: 10,6 m³/s
| Date | Mean value [m³/s] | Maximum [m³/s] | Minimum [m³/s] |
|---|---|---|---|
| 10.08.2022 | 0.287 | 0.3 | 0.256 |
| 09.08.2022 | 0.282 | 0.3 | 0.256 |
| 08.08.2022 | 0.292 | 0.3 | 0.256 |
| 07.08.2022 | 0.36 | 0.456 | 0.256 |
| 06.08.2022 | 0.507 | 1.02 | 0.237 |
| 05.08.2022 | 0.263 | 0.3 | 0.219 |
| 04.08.2022 | 0.267 | 0.323 | 0.203 |
© Bayerisches Landesamt für Umwelt 2024