
- Start >
- Rivers >
- Discharge >
- Untere Donau >
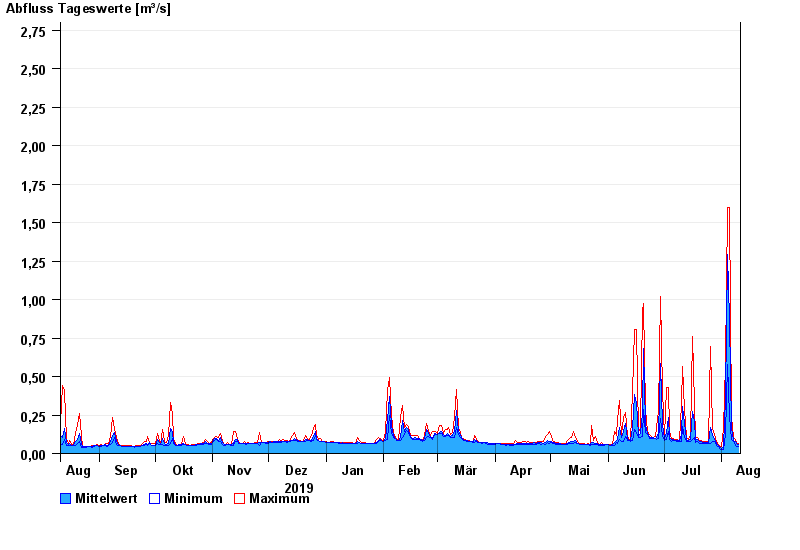
- Wallersdorf >
- Chart of year

Chart of year Wallersdorf / Reißingerbach
Discharge from 11.08.2019 to 10.08.2020
- 14.01.2011 Abfluss: 13,6 m³/s
- 03.06.2013 Abfluss: 13,1 m³/s
- 16.02.2006 Abfluss: 11,9 m³/s
- 04.08.1991 Abfluss: 10,8 m³/s
- 11.11.2002 Abfluss: 10,6 m³/s
| Date | Mean value [m³/s] | Maximum [m³/s] | Minimum [m³/s] |
|---|---|---|---|
| 10.08.2020 | 0.056 | 0.063 | 0.045 |
| 09.08.2020 | 0.062 | 0.074 | 0.045 |
| 08.08.2020 | 0.076 | 0.088 | 0.053 |
| 07.08.2020 | 0.084 | 0.104 | 0.075 |
| 06.08.2020 | 0.16 | 0.243 | 0.088 |
| 05.08.2020 | 0.868 | 1.6 | 0.243 |
| 04.08.2020 | 1.29 | 1.6 | 0.575 |
© Bayerisches Landesamt für Umwelt 2024