
- Start >
- Rivers >
- Discharge >
- Untere Donau >
- Passau Marienbrücke Q >
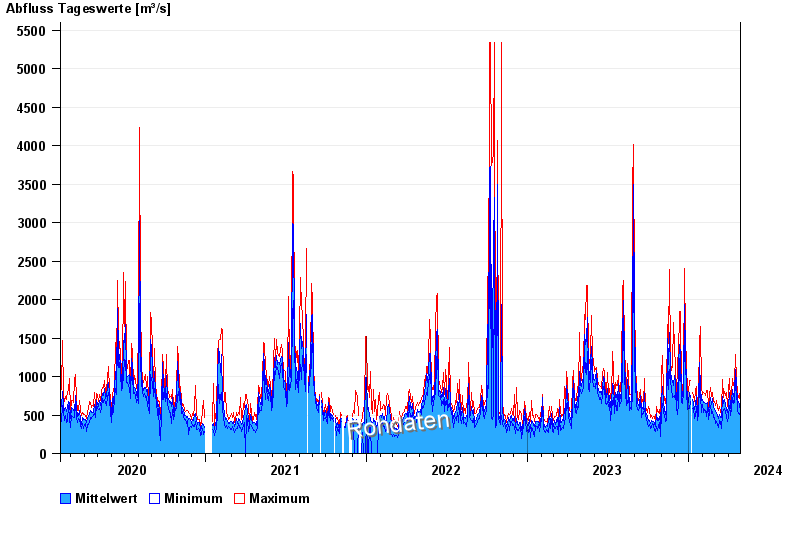
- Chart of total period

Chart of total period Passau Marienbrücke Q / Inn
Discharge from 07.02.2020 to 27.04.2024
 Für diesen Pegel sind keine -Winter hinterlegt.
| Date | Mean value [m³/s] | Maximum [m³/s] | Minimum [m³/s] |
|---|---|---|---|
| 27.04.2024 | 520 | 553 | 482 |
| 26.04.2024 | 549 | 628 | 487 |
| 25.04.2024 | 627 | 784 | 521 |
| 24.04.2024 | 673 | 732 | 513 |
| 23.04.2024 | 590 | 728 | 518 |
| 22.04.2024 | 624 | 723 | 518 |
| 21.04.2024 | 694 | 777 | 541 |
© Bayerisches Landesamt für Umwelt 2024