
- Start >
- Rivers >
- Discharge >
- Untere Donau >
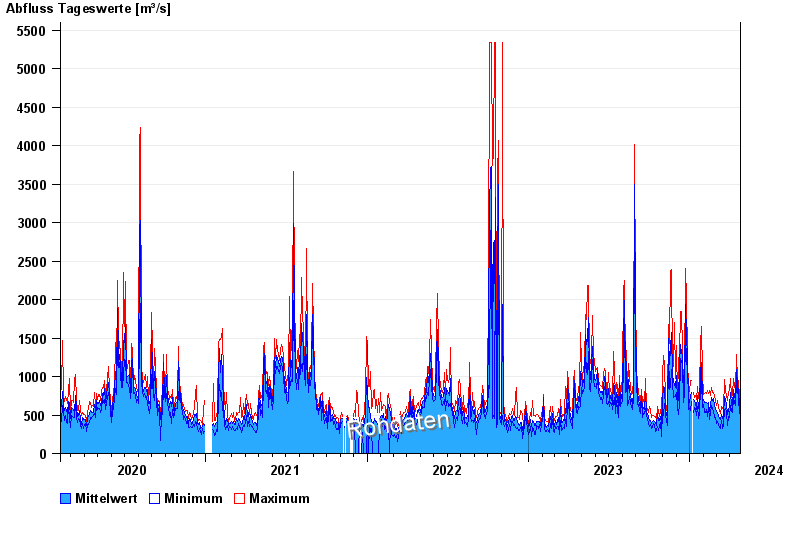
- Passau Marienbrücke Q >
- Chart of total period

Chart of total period Passau Marienbrücke Q / Inn
Discharge from 07.02.2020 to 24.04.2024
 Für diesen Pegel sind keine Hauptwerte hinterlegt.
| Date | Mean value [m³/s] | Maximum [m³/s] | Minimum [m³/s] |
|---|---|---|---|
| 24.04.2024 | 643 | 673 | 513 |
| 23.04.2024 | 590 | 728 | 518 |
| 22.04.2024 | 624 | 723 | 518 |
| 21.04.2024 | 694 | 777 | 541 |
| 20.04.2024 | 812 | 930 | 715 |
| 19.04.2024 | 824 | 931 | 760 |
| 18.04.2024 | 886 | 960 | 832 |
© Bayerisches Landesamt für Umwelt 2024