
- Start >
- Rivers >
- Discharge >
- Untere Donau >
- Passau Marienbrücke Q >
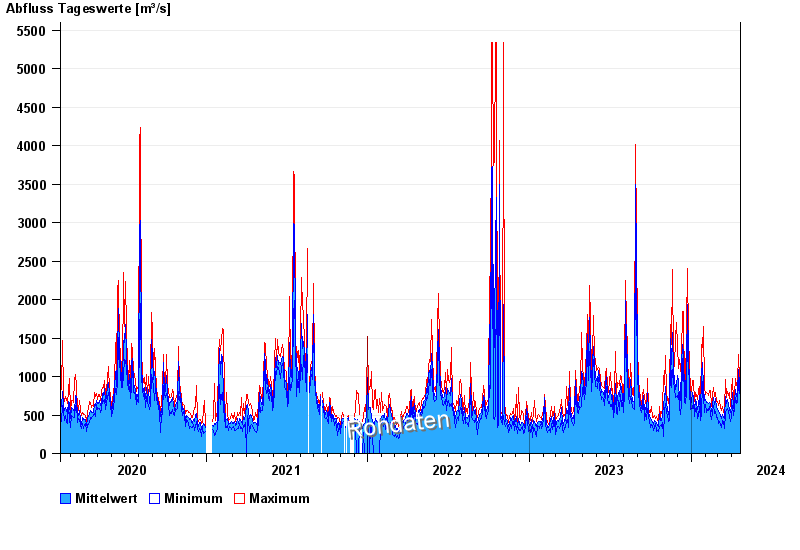
- Chart of total period

Chart of total period Passau Marienbrücke Q / Inn
Discharge from 07.02.2020 to 20.04.2024
| Date | Mean value [m³/s] | Maximum [m³/s] | Minimum [m³/s] |
|---|---|---|---|
| 20.04.2024 | 776 | 819 | 715 |
| 19.04.2024 | 824 | 931 | 760 |
| 18.04.2024 | 886 | 960 | 832 |
| 17.04.2024 | 945 | 1090 | 781 |
| 16.04.2024 | 1090 | 1280 | 943 |
| 15.04.2024 | 823 | 928 | 661 |
| 14.04.2024 | 690 | 822 | 623 |
© Bayerisches Landesamt für Umwelt 2024