
- Start >
- Rivers >
- Discharge >
- Untere Donau >
- Köfering >
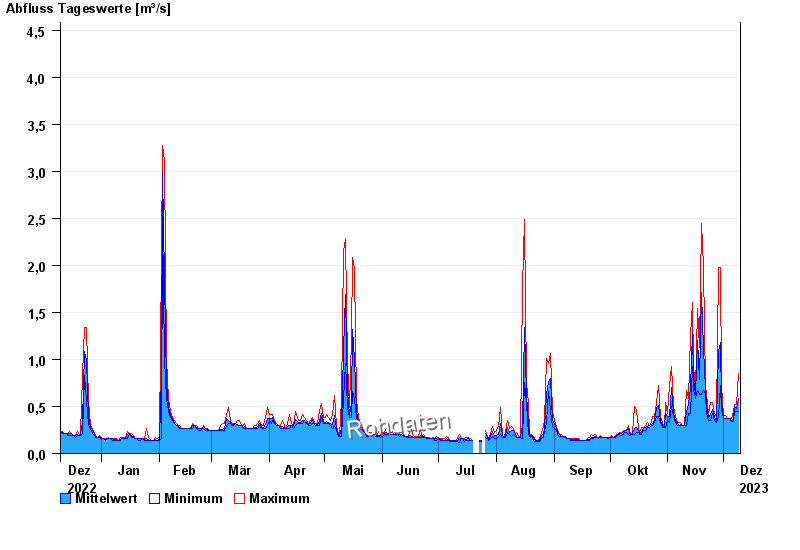
- Chart of year

Chart of year Köfering / Pfatter
Discharge from 10.12.2022 to 09.12.2023
- 14.01.2011 Abfluss: 16,8 m³/s
- 02.03.1987 Abfluss: 12,1 m³/s
- 09.03.2006 Abfluss: 10,8 m³/s
- 16.03.1988 Abfluss: 10,5 m³/s
- 21.12.1993 Abfluss: 10,3 m³/s
| Date | Mean value [m³/s] | Maximum [m³/s] | Minimum [m³/s] |
|---|---|---|---|
| 09.12.2023 | 0.582 | 0.846 | 0.442 |
| 08.12.2023 | 0.475 | 0.522 | 0.442 |
| 07.12.2023 | 0.5 | 0.522 | 0.442 |
| 06.12.2023 | 0.36 | 0.442 | 0.34 |
| 05.12.2023 | 0.356 | 0.372 | 0.34 |
| 04.12.2023 | 0.372 | 0.372 | 0.372 |
| 03.12.2023 | 0.372 | 0.372 | 0.372 |
© Bayerisches Landesamt für Umwelt 2024