
- Start >
- Rivers >
- Discharge >
- Untere Donau >
- Köfering >
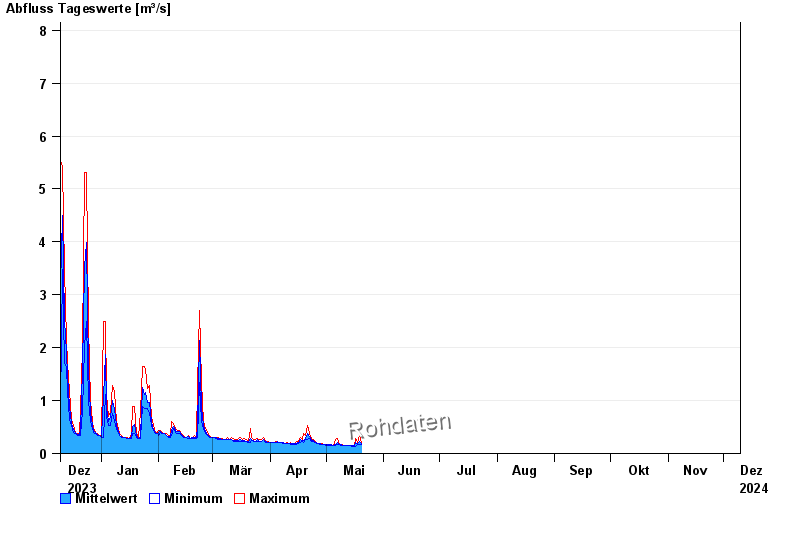
- Chart of year

Chart of year Köfering / Pfatter
Discharge from 10.12.2023 to 09.12.2024
- 14.01.2011 Abfluss: 16,8 m³/s
- 02.03.1987 Abfluss: 12,1 m³/s
- 09.03.2006 Abfluss: 10,8 m³/s
- 16.03.1988 Abfluss: 10,5 m³/s
- 21.12.1993 Abfluss: 10,3 m³/s
| Date | Mean value [m³/s] | Maximum [m³/s] | Minimum [m³/s] |
|---|---|---|---|
| 09.05.2024 | 0.173 | 0.175 | 0.159 |
| 08.05.2024 | 0.175 | 0.175 | 0.175 |
| 07.05.2024 | 0.201 | 0.282 | 0.175 |
| 06.05.2024 | 0.168 | 0.256 | 0.159 |
| 05.05.2024 | 0.159 | 0.159 | 0.159 |
| 04.05.2024 | 0.162 | 0.175 | 0.159 |
| 03.05.2024 | 0.166 | 0.175 | 0.159 |
© Bayerisches Landesamt für Umwelt 2024