
- Start >
- Rivers >
- Discharge >
- Untere Donau >
- Köfering >
- Chart of year

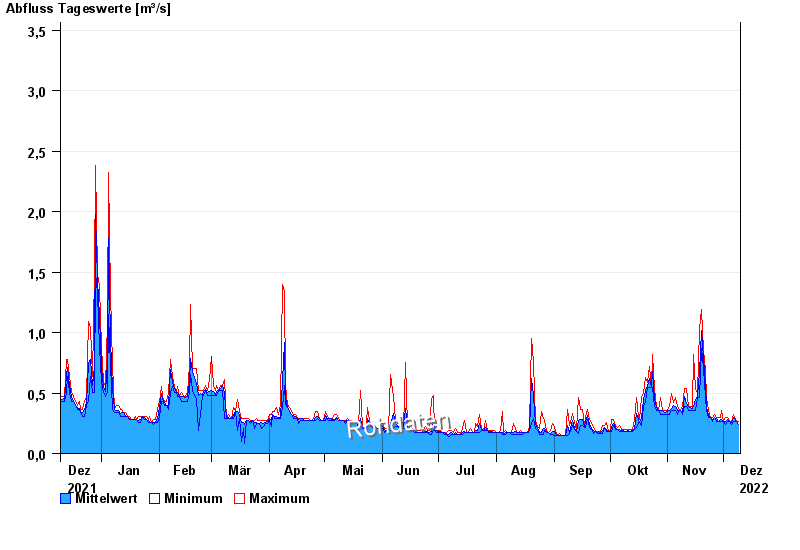
Chart of year Köfering / Pfatter
Discharge from 10.12.2021 to 09.12.2022
- 14.01.2011 Abfluss: 16,8 m³/s
- 02.03.1987 Abfluss: 12,1 m³/s
- 09.03.2006 Abfluss: 10,8 m³/s
- 16.03.1988 Abfluss: 10,5 m³/s
- 21.12.1993 Abfluss: 10,3 m³/s
| Date | Mean value [m³/s] | Maximum [m³/s] | Minimum [m³/s] |
|---|---|---|---|
| 09.12.2022 | 0.241 | 0.265 | 0.239 |
| 08.12.2022 | 0.265 | 0.265 | 0.265 |
| 07.12.2022 | 0.288 | 0.294 | 0.265 |
| 06.12.2022 | 0.299 | 0.324 | 0.265 |
| 05.12.2022 | 0.257 | 0.265 | 0.239 |
| 04.12.2022 | 0.265 | 0.265 | 0.265 |
| 03.12.2022 | 0.284 | 0.294 | 0.265 |
© Bayerisches Landesamt für Umwelt 2024