
- Start >
- Rivers >
- Discharge >
- Untere Donau >
- Deggendorf >
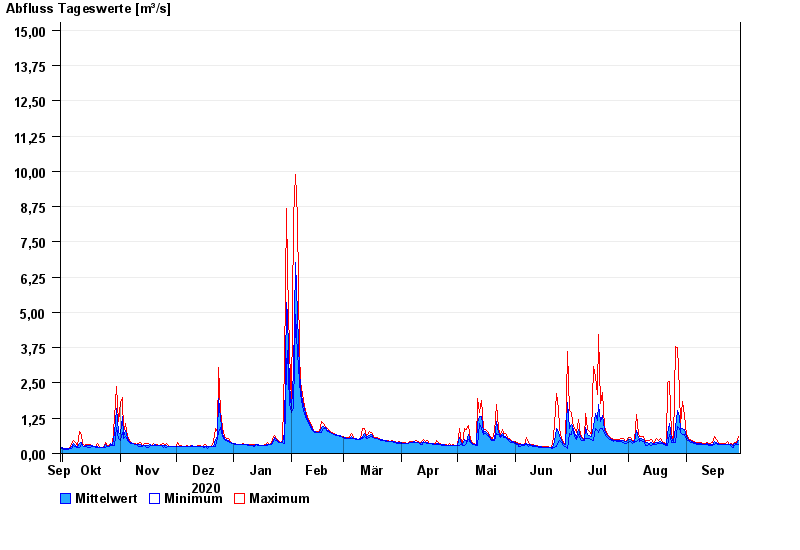
- Chart of year

Chart of year Deggendorf / Kollbach
Discharge from 30.09.2020 to 29.09.2021
- 13.01.2011 Abfluss: 26,1 m³/s
- 13.08.2002 Abfluss: 23,3 m³/s
- 08.12.1974 Abfluss: 22,6 m³/s
- 20.03.2002 Abfluss: 21,1 m³/s
- 23.02.1970 Abfluss: 19,6 m³/s
| Date | Mean value [m³/s] | Maximum [m³/s] | Minimum [m³/s] |
|---|---|---|---|
| 29.09.2021 | 0.465 | 0.615 | 0.335 |
| 28.09.2021 | 0.341 | 0.383 | 0.331 |
| 27.09.2021 | 0.341 | 0.377 | 0.296 |
| 26.09.2021 | 0.301 | 0.318 | 0.215 |
| 25.09.2021 | 0.317 | 0.355 | 0.253 |
| 24.09.2021 | 0.319 | 0.327 | 0.307 |
| 23.09.2021 | 0.324 | 0.41 | 0.311 |
© Bayerisches Landesamt für Umwelt 2024