
- Start >
- Rivers >
- Discharge >
- Untere Donau >
- Deggendorf >
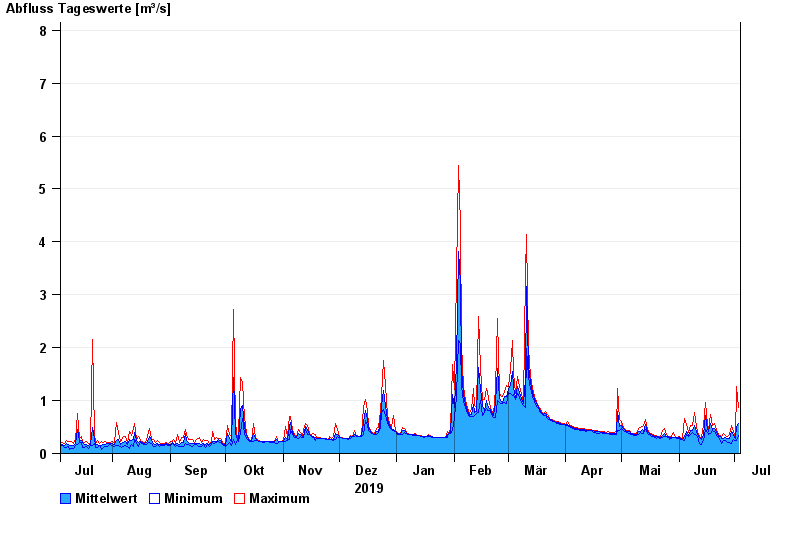
- Chart of year

Chart of year Deggendorf / Kollbach
Discharge from 04.07.2019 to 03.07.2020
- 13.01.2011 Abfluss: 26,1 m³/s
- 13.08.2002 Abfluss: 23,3 m³/s
- 08.12.1974 Abfluss: 22,6 m³/s
- 20.03.2002 Abfluss: 21,1 m³/s
- 23.02.1970 Abfluss: 19,6 m³/s
| Date | Mean value [m³/s] | Maximum [m³/s] | Minimum [m³/s] |
|---|---|---|---|
| 03.07.2020 | 0.575 | 0.877 | 0.341 |
| 02.07.2020 | 0.505 | 1.27 | 0.237 |
| 01.07.2020 | 0.278 | 0.306 | 0.245 |
| 30.06.2020 | 0.347 | 0.422 | 0.272 |
| 29.06.2020 | 0.41 | 0.528 | 0.197 |
| 28.06.2020 | 0.276 | 0.35 | 0.2 |
| 27.06.2020 | 0.278 | 0.322 | 0.209 |
© Bayerisches Landesamt für Umwelt 2024