
- Start >
- Rivers >
- Discharge >
- Untere Donau >
- Deggendorf >
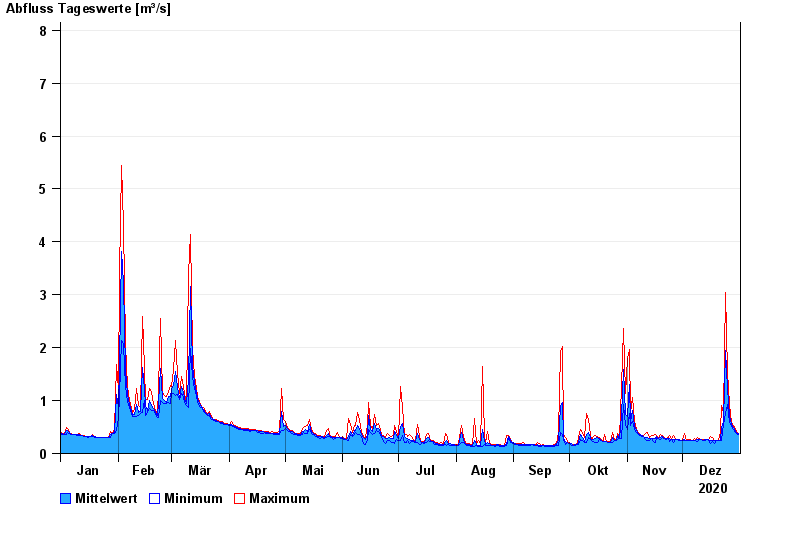
- Chart of year

Chart of year Deggendorf / Kollbach
Discharge from 01.01.2020 to 31.12.2020
- 13.01.2011 Abfluss: 26,1 m³/s
- 13.08.2002 Abfluss: 23,3 m³/s
- 08.12.1974 Abfluss: 22,6 m³/s
- 20.03.2002 Abfluss: 21,1 m³/s
- 23.02.1970 Abfluss: 19,6 m³/s
| Date | Mean value [m³/s] | Maximum [m³/s] | Minimum [m³/s] |
|---|---|---|---|
| 31.12.2020 | 0.373 | 0.385 | 0.365 |
| 30.12.2020 | 0.399 | 0.423 | 0.385 |
| 29.12.2020 | 0.458 | 0.515 | 0.423 |
| 28.12.2020 | 0.482 | 0.515 | 0.459 |
| 27.12.2020 | 0.539 | 0.595 | 0.505 |
| 26.12.2020 | 0.717 | 0.918 | 0.595 |
| 25.12.2020 | 1.23 | 1.53 | 0.918 |
© Bayerisches Landesamt für Umwelt 2024