
- Start >
- Rivers >
- Discharge >
- Untere Donau >
- Deggendorf >
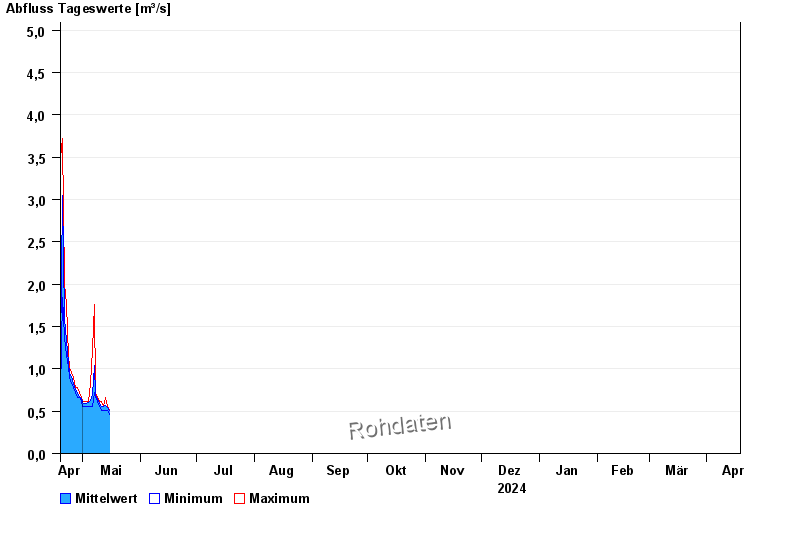
- Chart of year

Chart of year Deggendorf / Kollbach
Discharge from 19.04.2024 to 18.04.2025
- 13.01.2011 Abfluss: 26,1 m³/s
- 13.08.2002 Abfluss: 23,3 m³/s
- 08.12.1974 Abfluss: 22,6 m³/s
- 20.03.2002 Abfluss: 21,1 m³/s
- 23.02.1970 Abfluss: 19,6 m³/s
| Date | Mean value [m³/s] | Maximum [m³/s] | Minimum [m³/s] |
|---|---|---|---|
| 01.05.2024 | 0.602 | 0.611 | 0.56 |
| 30.04.2024 | 0.647 | 0.664 | 0.611 |
| 29.04.2024 | 0.679 | 0.718 | 0.664 |
| 28.04.2024 | 0.706 | 0.775 | 0.664 |
| 27.04.2024 | 0.758 | 0.775 | 0.718 |
| 26.04.2024 | 0.822 | 0.895 | 0.775 |
| 25.04.2024 | 0.904 | 0.958 | 0.832 |
© Bayerisches Landesamt für Umwelt 2024