
- Start >
- Rivers >
- Discharge >
- Untere Donau >
- Deggendorf >
- Chart of year

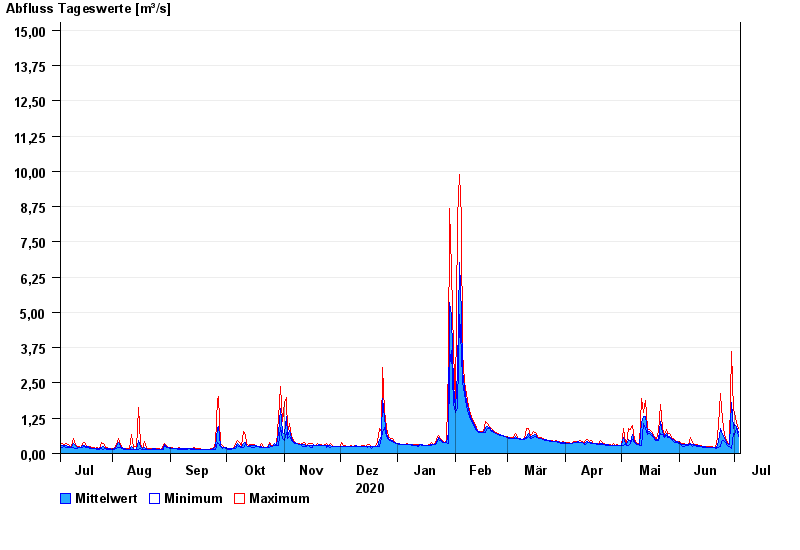
Chart of year Deggendorf / Kollbach
Discharge from 04.07.2020 to 03.07.2021
- 13.01.2011 Abfluss: 26,1 m³/s
- 13.08.2002 Abfluss: 23,3 m³/s
- 08.12.1974 Abfluss: 22,6 m³/s
- 20.03.2002 Abfluss: 21,1 m³/s
- 23.02.1970 Abfluss: 19,6 m³/s
| Date | Mean value [m³/s] | Maximum [m³/s] | Minimum [m³/s] |
|---|---|---|---|
| 03.07.2021 | 0.737 | 0.897 | 0.585 |
| 02.07.2021 | 0.969 | 1.09 | 0.886 |
| 01.07.2021 | 1.04 | 1.44 | 0.656 |
| 30.06.2021 | 0.876 | 1.52 | 0.695 |
| 29.06.2021 | 1.8 | 3.63 | 0.184 |
| 28.06.2021 | 0.314 | 0.339 | 0.249 |
| 27.06.2021 | 0.365 | 0.4 | 0.296 |
© Bayerisches Landesamt für Umwelt 2024