
- Start >
- Rivers >
- Discharge >
- Untere Donau >
- Deggendorf >
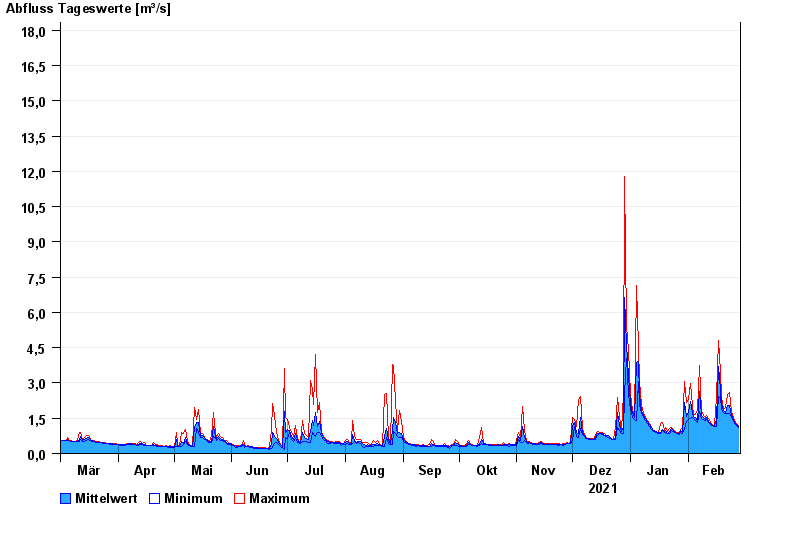
- Chart of year

Chart of year Deggendorf / Kollbach
Discharge from 01.03.2021 to 28.02.2022
- 13.01.2011 Abfluss: 26,1 m³/s
- 13.08.2002 Abfluss: 23,3 m³/s
- 08.12.1974 Abfluss: 22,6 m³/s
- 20.03.2002 Abfluss: 21,1 m³/s
- 23.02.1970 Abfluss: 19,6 m³/s
| Date | Mean value [m³/s] | Maximum [m³/s] | Minimum [m³/s] |
|---|---|---|---|
| 28.02.2022 | 1.15 | 1.18 | 1.11 |
| 27.02.2022 | 1.22 | 1.28 | 1.17 |
| 26.02.2022 | 1.32 | 1.39 | 1.27 |
| 25.02.2022 | 1.46 | 1.54 | 1.39 |
| 24.02.2022 | 1.63 | 1.77 | 1.53 |
| 23.02.2022 | 2.03 | 2.58 | 1.72 |
| 22.02.2022 | 2.06 | 2.49 | 1.72 |
© Bayerisches Landesamt für Umwelt 2024