
- Start >
- Rivers >
- Discharge >
- Untere Donau >
- Deggendorf >
- Chart of year

Chart of year Deggendorf / Kollbach
Discharge from 06.03.2022 to 05.03.2023
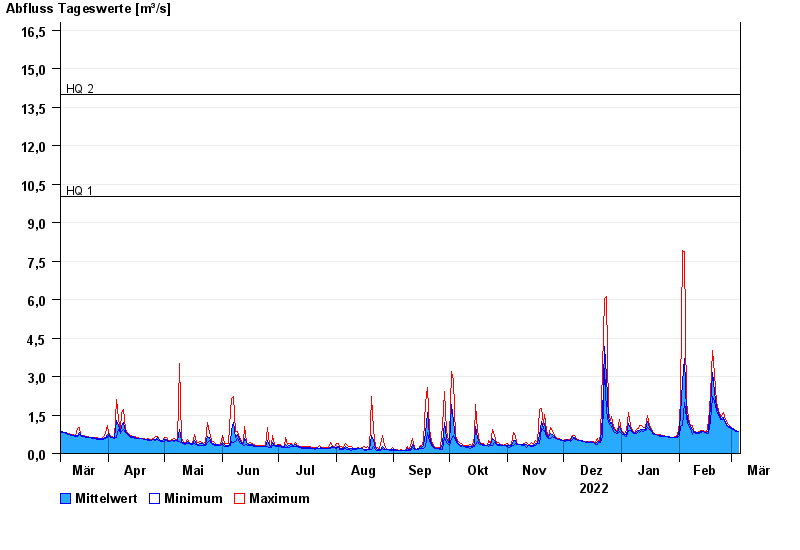
- HQ1 10 m³/s
- HQ2 14 m³/s
- HQ5 17 m³/s
- HQ10 20 m³/s
- HQ20 22 m³/s
- HQ50 25 m³/s
- HQ100 27 m³/s
| Date | Mean value [m³/s] | Maximum [m³/s] | Minimum [m³/s] |
|---|---|---|---|
| 05.03.2023 | 0.869 | 0.877 | 0.859 |
| 04.03.2023 | 0.885 | 0.902 | 0.865 |
| 03.03.2023 | 0.923 | 0.953 | 0.896 |
| 02.03.2023 | 0.966 | 0.985 | 0.947 |
| 01.03.2023 | 0.999 | 1.02 | 0.979 |
| 28.02.2023 | 1.04 | 1.08 | 1.01 |
| 27.02.2023 | 1.11 | 1.16 | 1.07 |
© Bayerisches Landesamt für Umwelt 2024