
- Start >
- Rivers >
- Discharge >
- Untere Donau >
- Deggendorf >
- Chart of year

Chart of year Deggendorf / Kollbach
Discharge from 06.03.2020 to 05.03.2021
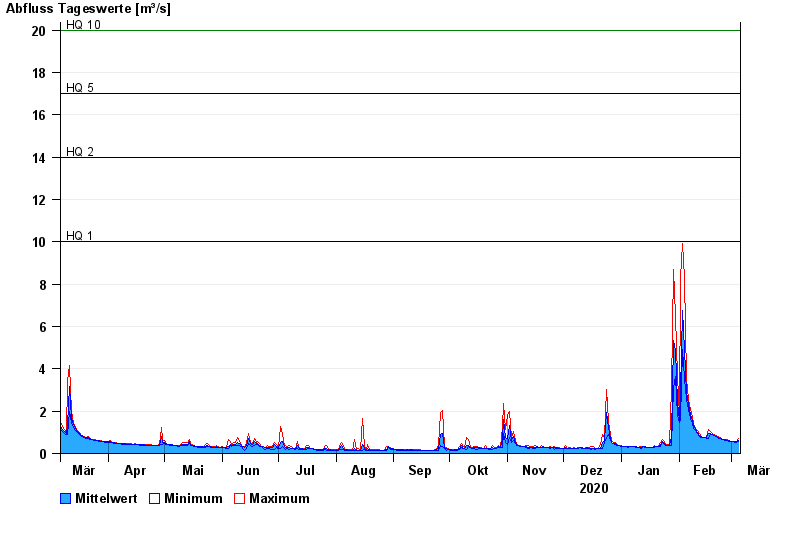
- HQ1 10 m³/s
- HQ2 14 m³/s
- HQ5 17 m³/s
- HQ10 20 m³/s
- HQ20 22 m³/s
- HQ50 25 m³/s
- HQ100 27 m³/s
| Date | Mean value [m³/s] | Maximum [m³/s] | Minimum [m³/s] |
|---|---|---|---|
| 05.03.2021 | 0.61 | 0.701 | 0.544 |
| 04.03.2021 | 0.544 | 0.554 | 0.539 |
| 03.03.2021 | 0.547 | 0.564 | 0.539 |
| 02.03.2021 | 0.559 | 0.565 | 0.545 |
| 01.03.2021 | 0.578 | 0.585 | 0.565 |
| 28.02.2021 | 0.597 | 0.601 | 0.585 |
| 27.02.2021 | 0.622 | 0.638 | 0.601 |
© Bayerisches Landesamt für Umwelt 2024