
- Start >
- Rivers >
- Discharge >
- Untere Donau >
- Appolding >
- Chart of year

Chart of year Appolding / Strogen
Discharge from 24.05.2021 to 23.05.2022
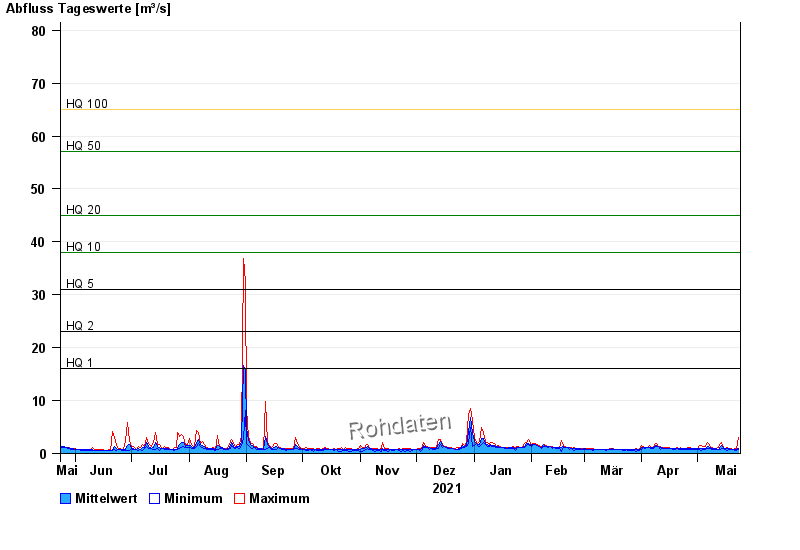
- HQ1 16 m³/s
- HQ2 23 m³/s
- HQ5 31 m³/s
- HQ10 38 m³/s
- HQ20 45 m³/s
- HQ50 57 m³/s
- HQ100 65 m³/s
| Date | Mean value [m³/s] | Maximum [m³/s] | Minimum [m³/s] |
|---|---|---|---|
| 23.05.2022 | 0.968 | 3.01 | 0.677 |
| 22.05.2022 | 0.743 | 0.851 | 0.625 |
| 21.05.2022 | 0.73 | 0.851 | 0.625 |
| 20.05.2022 | 0.759 | 0.79 | 0.677 |
| 19.05.2022 | 0.777 | 0.851 | 0.677 |
| 18.05.2022 | 0.854 | 0.916 | 0.677 |
| 17.05.2022 | 0.896 | 1.12 | 0.575 |
© Bayerisches Landesamt für Umwelt 2024