
- Start >
- Rivers >
- Discharge >
- Untere Donau >
- Appolding >
- Chart of year

Chart of year Appolding / Strogen
Discharge from 24.05.2022 to 23.05.2023
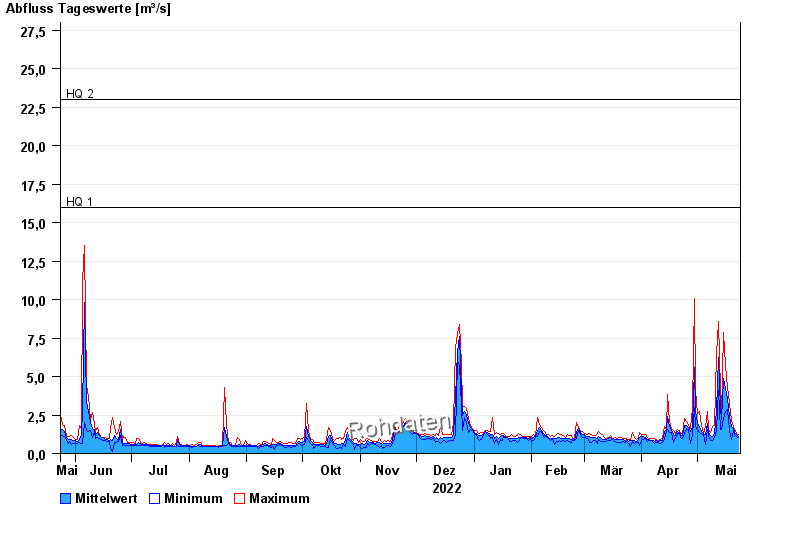
- HQ1 16 m³/s
- HQ2 23 m³/s
- HQ5 31 m³/s
- HQ10 38 m³/s
- HQ20 45 m³/s
- HQ50 57 m³/s
- HQ100 65 m³/s
| Date | Mean value [m³/s] | Maximum [m³/s] | Minimum [m³/s] |
|---|---|---|---|
| 23.05.2023 | 1.11 | 1.21 | 1.05 |
| 22.05.2023 | 1.26 | 1.3 | 1.13 |
| 21.05.2023 | 1.37 | 1.55 | 1.21 |
| 20.05.2023 | 1.6 | 1.75 | 1.47 |
| 19.05.2023 | 1.74 | 2.16 | 0.91 |
| 18.05.2023 | 2.39 | 3.25 | 1.47 |
| 17.05.2023 | 3.6 | 4.27 | 2.86 |
© Bayerisches Landesamt für Umwelt 2024