
- Start >
- Rivers >
- Discharge >
- Untere Donau >
- Appolding >
- Chart of year

Chart of year Appolding / Strogen
Discharge from 24.05.2020 to 23.05.2021
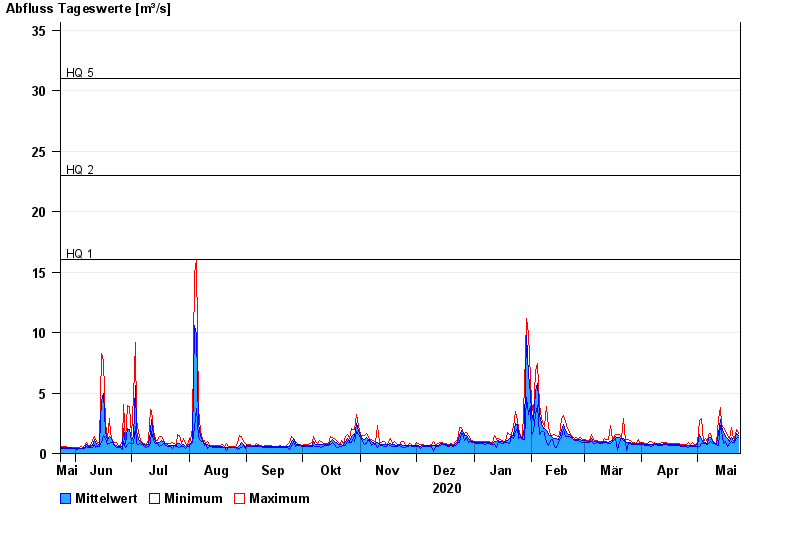
- HQ1 16 m³/s
- HQ2 23 m³/s
- HQ5 31 m³/s
- HQ10 38 m³/s
- HQ20 45 m³/s
- HQ50 57 m³/s
- HQ100 65 m³/s
| Date | Mean value [m³/s] | Maximum [m³/s] | Minimum [m³/s] |
|---|---|---|---|
| 23.05.2021 | 1.47 | 1.62 | 1.34 |
| 22.05.2021 | 1.65 | 1.94 | 1.22 |
| 21.05.2021 | 1.03 | 1.22 | 0.919 |
| 20.05.2021 | 1.1 | 1.23 | 0.888 |
| 19.05.2021 | 1.27 | 2.08 | 0.951 |
| 18.05.2021 | 1.03 | 1.25 | 0.8 |
| 17.05.2021 | 1.2 | 1.42 | 0.568 |
© Bayerisches Landesamt für Umwelt 2024