
- Start >
- Rivers >
- Discharge >
- Naab - Regen >
- Vilseck >
- Chart of total period

Chart of total period Vilseck / Vils
Discharge from 01.11.1964 to 26.04.2024
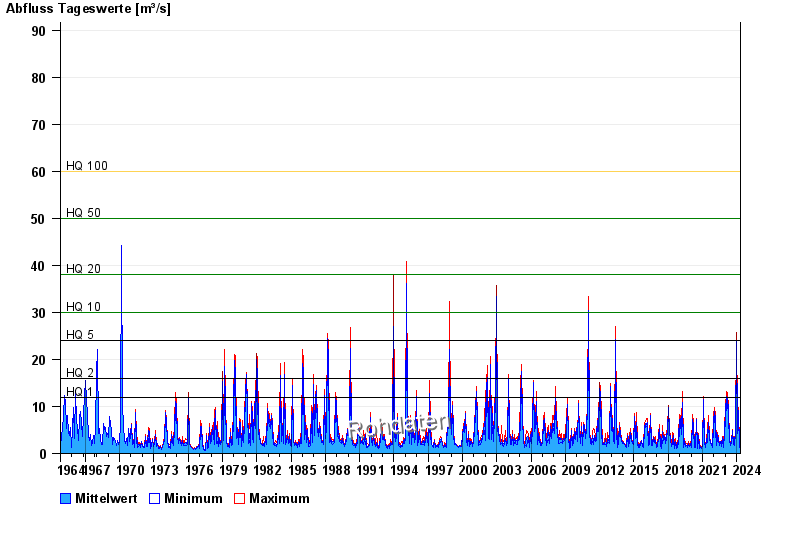
- HQ1 12 m³/s
- HQ2 16 m³/s
- HQ5 24 m³/s
- HQ10 30 m³/s
- HQ20 38 m³/s
- HQ50 50 m³/s
- HQ100 60 m³/s
| Date | Mean value [m³/s] | Maximum [m³/s] | Minimum [m³/s] |
|---|---|---|---|
| 26.04.2024 | 1.95 | 2.15 | 1.84 |
| 25.04.2024 | 2.08 | 2.22 | 1.96 |
| 24.04.2024 | 2.17 | 2.43 | 2.02 |
| 23.04.2024 | 2.56 | 3.06 | 2.36 |
| 22.04.2024 | 3.11 | 3.48 | 2.89 |
| 21.04.2024 | 2.99 | 3.57 | 2.36 |
| 20.04.2024 | 2.63 | 2.73 | 2.5 |
© Bayerisches Landesamt für Umwelt 2024